Poster Session B - Monday Morning
Category: IBD
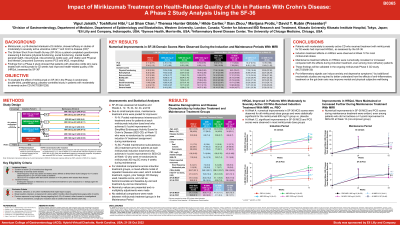
B0365 - Impact of Mirikizumab Treatment on Health-Related Quality of Life in Patients With Crohn’s Disease: A Phase 2 Study Analysis Using the SF-36


David T. Rubin, MD, FACG
University of Chicago Medicine Inflammatory Bowel Disease Center
Chicago, IL
Presenting Author(s)
1Western University, London, ON, Canada; 2Center for Advanced IBD Research and Treatment Kitasato, University Kitasato Institute Hospital, Minato-ku, Tokyo, Japan; 3Eli Lilly and Company, Indianapolis, IN; 4Syneos Health, Morrisville, NC; 5University of Chicago Medicine Inflammatory Bowel Disease Center, Chicago, IL
Introduction: This analysis evaluated Mirikizumab (miri) effects on Short Form Health Survey (SF-36) in the Phase (Ph)2 randomised, double-blind, parallel, placebo (PBO)-controlled study in patients (pts) with moderately-to-severely active Crohn’s disease (CD).
Methods: 12-Week(W) Induction: 191 pts were randomized 2:1:1:2 to 4 treatment arms: intravenous (IV) PBO, 200, 600, or 1000mg miri every 4 weeks (Q4W; W0, 4, and 8). 40-W Maintenance: For miri induction dose, pts achieving ≥1-point improvement in Simple Endoscopic Score for CD (SES-CD) at W12 were re-randomized 1:1 to double-blind maintenance treatment from W12 to W48: continuation of induction IV treatment assignment (IV-IV; N=41) or subcutaneous (SC) 300mg miri Q4W (IV-SC; N=46). Due to small sample sizes, maintenance IV arms and SC arms were pooled. W12 SES-CD non-improvers (N=30) and pts receiving PBO during induction (N=59) received IV 1000mg miri Q4W from W12 to W48. No statistical comparisons were made between miri treatment groups in the maintenance period. SF-36 was assessed at baseline and at W4,12,16, 24, 32, 44, and 52.
Results: Statistically significant improvement in MCS was observed at W4 (600mg dose level) and at W12 (all dose levels), whereas statistically significant improvements in PCS were observed only at W12 (600 and 1000mg dose levels) compared to PBO (Table). Though statistical comparisons were not made between treatment groups during maintenance, comparison of mean changes in MCS and PCS suggest that improvements during induction were sustained or further numerically increased with miri maintenance treatment, even in induction SES-CD non-improvers (Table).
Discussion: These data show that miri treatment improves health related quality of life in pts with moderately to severely active CD and suggest an earlier impact on mental compared to physical wellbeing. Maintenance treatment effects were numerically consistent or increased compared to induction effects, even among more refractory pts. These findings will be validated in the ongoing miri Ph3 CD study (NCT03926130). Proinflammatory signals can induce anxiety and depressive symptoms; better understanding of how the effects of anti-inflammatory treatment on the gut-brain axis may improve mental and physical subjective wellbeing requires additional mechanistic studies.
| Mental Component Score (MCS) | Physical Component Score (PCS) | ||||||
Induction Period | PBO (N=64) | 200 mg IV miri (N=31) | 600 mg IV miri (N=32) | 1000 mg IV miri (N=64) | PBO (N=64) | 200 mg IV miri (N=31) | 600 mg IV miri (N=32) | 1000 mg IV miri (N=64) |
W0 Baseline (Mean ± SD) | 37.0 ± 13.2 | 35.2 ± 10.2 | 41.1 ± 10.4 | 40.4 ± 11.6 | 38.9 ± 8.3 | 38.4 ± 6.4 | 42.9 ± 7.8 | 39.5 ± 8.6 |
W4 CFBL | 1.9 ± 1.0 | 2.6 ± 1.4 | 5.2 ± 1.4* | 3.1 ± 1.0 | 2.4 ± 0.7 | 3.3 ± 1.0 | 3.4 ± 1.0 | 4.2 ± 0.7 |
W12 CFBL (LSM ± SE) | 2.3 ± 1.1 | 7.5 ± 1.6* | 6.5 ± 1.6* | 6.1 ± 1.2* | 3.1 ± 0.8 | 4.7 ± 1.1 | 8.0 ± 1.1** | 6.7 ± 0.8** |
Maintenance Period | PBO-1000mg IV miri (N=59) | NI-1000mg IV miri (N=30) | All IV-IV miri (N=41) | All IV-SC miri (N=46) | PBO-1000mg IV miri (N=59) | NI-1000mg IV miri (N=30) | All IV-IV miri (N=41) | All IV-SC miri (N=46) |
W0 Baseline | 37.2 ±13.0 | 38.0 ±11.2 | 42.0 ± 10.1 | 38.7 ±10.7 | 39.5 ± 8.1 | 40.8 ± 8.3 | 41.1 ± 8.5 | 38.1 ± 7.1 |
W24 CFBL (Mean ± SD) | 7.4 ± 8.7 | 7.7 ± 11.7 | 7.0 ± 10.6 | 5.9 ± 13.1 | 6.8 ± 7.3 | 7.1 ± 7.8 | 9.6 ± 5.6 | 7.1 ± 8.3 |
W52 CFBL (Mean ± SD) | 7.1 ± 10.6 | 7.3 ± 9.8 | 8.5 ± 11.3 | 11.5 ± 11.4 | 9.9 ± 7.2 | 7.1 ± 8.2 | 10.2 ± 8.7 | 10.7 ± 7.9 |
Abbreviations: CFBL = change from baseline; IV = intravenous; IV-IV = pooled maintenance IV treatment arms for patients at each miri induction dose level who achieved ≥1-point improvement in SES-CD at W12 who were re-randomized to continued induction IV treatment assignment during maintenance; IV-SC = pooled maintenance SC treatment arms for patients at each miri induction dose level who achieved ≥1-point improvement in SES-CD at W12 who were re-randomized to SC 300mg miri Q4W during maintenance; LSM = least squares mean; NI = SES-CD non-improver (a patient who received miri during induction who did not achieve a ≥1-point improvement in SES-CD at W12); PBO = placebo; SC = subcutaneous; SD = standard deviation; SE = standard error; W = week. For statistical comparisons across induction treatment groups, a mixed model for repeated measures was used. The model includes treatment, region, prior biologic CD therapy used, baseline, visit and baseline by visit, and treatment by visit.
p-values versus PBO: *p< 0.05; ** p≤0.001. Bolded values are statistically different versus PBO. | ||||||||
Disclosures:
Vipul Jairath, MBChB, DPhil1, Toshifumi Hibi, MD, PhD2, Lai-Shan Chan, MSc3, Theresa Hunter Gibble, PhD3, Hilde Carlier, 3, Xian Zhou, 4, Marijana Protic, MD, PhD3, David T. Rubin, MD, FACG5. B0365 - Impact of Mirikizumab Treatment on Health-Related Quality of Life in Patients With Crohn’s Disease: A Phase 2 Study Analysis Using the SF-36, ACG 2022 Annual Scientific Meeting Abstracts. Charlotte, NC: American College of Gastroenterology.
