Poster Session B - Monday Morning
Category: Colorectal Cancer Prevention
B0164 - Impact of COVID-19 on Trends and Healthcare Disparities on Utilization of Screening Colonoscopy


Rajat Garg, MD
Cleveland Clinic Foundation
Cleveland, Ohio
Presenting Author(s)
1Cleveland Clinic Foundation, Cleveland, OH; 2Cleveland Clinic, Cleveland, OH; 3Cleveland Clinic, Cleveland, OH; 4Digestive Disease and Surgery Institute, Cleveland Clinic, Cleveland, OH
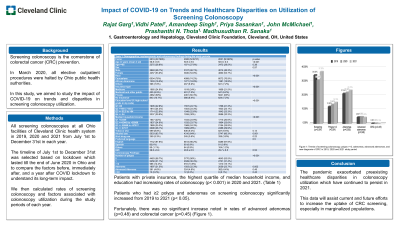
Introduction: Screening colonoscopy is the cornerstone of colorectal cancer (CRC) prevention. In March 2020, all elective outpatient procedures were halted by Ohio public health authorities. In this study, we aimed to study the impact of COVID-19 on trends and disparities in screening colonoscopy utilization.
Methods: We identified all patients who underwent colonoscopy at Cleveland Clinic Ohio facilities in 2019 to 2021 from July 1st to December 31st respective year. The timeline of July 1st to December 31st was selected based on lockdown which lasted till the end of June 2020 in Ohio and to compare the factors before, immediately after, and a year after COVID lockdown to understand its long-term impact. We then calculated rates of screening colonoscopy and factors associated with colonoscopy utilization during the study periods of each year.
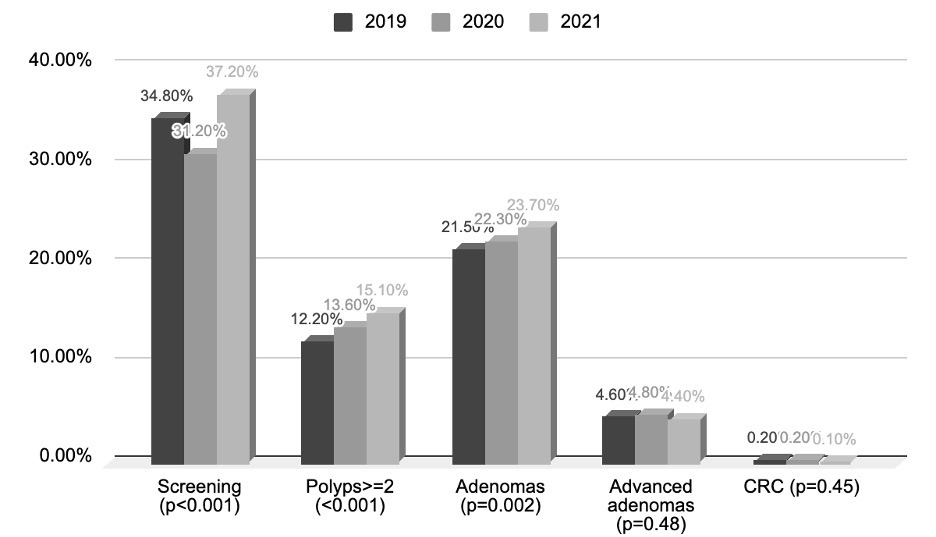
Results: Among the total of 68206 colonoscopies, 23316 (34.2%) were screening colonoscopies. The rate of screening colonoscopy significantly declined in 2020 (31.2%) and then increased to 37.2% in 2021 as compared to 34.8% in 2020 (p< 0.001) (Figure 1). The mean age of patients significantly went down after the COVID pandemic (p< 0.001), but proportion of seniors (age >65) and the male: female ratio remained the same. In Caucasians, the rate of colonoscopy initially declined in 2020 (74.2%) then increased over 2019 (46%) levels in 2021 (76.9%) whereas utilization of colonoscopy in African Americans initially increased in 2020 (18.9%) and then decreased to even less than 2019 (16.5%) in 2021 (15.9%) (p< 0.001) (Table 1). Patients with private insurance, the highest quartile of median household income, and education had increasing rates of colonoscopy (p< 0.001) in 2020 and 2021. Patients who had ≥2 polyps (12.2%, 13.6% and 15.1%) and adenomas (21.5%, 22.3% and 23.7%) on screening colonoscopy significantly increased from 2019 to 2021 (p< 0.05) (Figure 1). Fortunately, there was no significant increase noted in rates of advanced adenomas (p=0.48) and colorectal cancer (p=0.45) (Figure 1).
Discussion: The pandemic exacerbated preexisting healthcare disparities in colonoscopy utilization which have continued to persist in 2021. The number of polyps and adenomas detected on screening colonoscopy has significantly increased in the post-pandemic lockdown period but that did not translate into excess advanced adenoma detection or CRC rates. This data will assist current and future efforts to increase the uptake of CRC screening, especially in marginalized populations.

Table 1: Demographics, socioeconomic and clinical factors in each year’s study period. | ||||
Factor | 2019 (N=7905) | 2020 (N=6737) | 2021 (N=8674) | p-value |
Age (mean ± sd) | 59.8 ± 8.6 | 59.6 ± 8.9 | 58.9 ± 9.3 | < 0.001 |
Age >=65 | 2275 (28.8%) | 1871 (27.8%) | 2472 (28.5%) | 0.38 |
Sex | 0.97 | |||
Male | 3648 (46.1%) | 3107 (46.1%) | 4014 (46.3%) | |
Female | 4257 (53.9%) | 3630 (53.9%) | 4660 (53.7%) | |
Race | < 0.001 | |||
Caucasians | 6004 (76%) | 4999 (74.2%) | 6672 (76.9%) | |
African Americans | 1303 (16.5%) | 1271 (18.9%) | 1381 (15.9%) | |
Others | 598 (7.6%) | 467 (6.9%) | 621 (7.2%) | |
Insurance type | < 0.001 | |||
Medicare | 1965 (24.9%) | 1619 (24%) | 1868 (21.5%) | |
Medicaid and other public | 435 (5.5%) | 491 (7.3%) | 541 (6.2%) | |
Private | 4662 (59%) | 4061 (60.3%) | 5641 (65%) | |
No insurance | 843 (10.7%) | 566 (8.4%) | 624 (7.2%) | |
Education level (% high school grads in zip code) | < 0.001 | |||
Q1< 88 | 1905 (22.8%) | 1557 (24.1%) | 1768 (21.3%) | |
Q2 >=88 to < 92.5 | 1815 (24.3%) | 1503 (23.3%) | 1923 (23.1%) | |
Q3 >= 92.5 to < 94 | 1714 (22.9%) | 1549 (22.6%) | 1942 (23.3%) | |
Q4 >= 94 | 2237 (29.9%) | 1935 (30%) | 2686 (32.3%) | |
Median household income | < 0.001 | |||
Q1 < 43449 | 1647 (22%) | 1544 (23.9%) | 1715 (20.6%) | |
Q2 >=43449 to < 55969 | 1837 (24.6%) | 1532 (23.7%) | 1964 (23.6%) | |
Q3 >= 55969 to < 67917 | 1889 (25.3%) | 1569 (24.3%) | 2154 (25.9%) | |
Q4 >= 67917 | 2098 (28.1%) | 1809 (28%) | 2486 (29.9%) | |
Tobacco Use | 699 (8.8%) | 636 (9.4%) | 827 (9.5%) | 0.13 |
Alcohol use | 5033 (63.7%) | 4310 (64%) | 5747 (66.3%) | 0.001 |
Illicit drug use | 259 (3.3%) | 245 (3.6%) | 326 (3.8%) | 0.22 |
Preferred language | 0.5 | |||
English | 7732 (97.8%) | 6613 (98.2%) | 8489 (97.9%) | |
Spanish | 83(1%) | 60 (0.9%) | 81 (0.9%) | |
Others | 90 (1.1%) | 64 (0.9%) | 104 (1.2%) | |
BMI | 29.6 ± 6.4 | 29.8 ± 6.5 | 29.7 ± 6.5 | 0.52 |
Number of polyps | < 0.001 | |||
0 | 4483 (56.7%) | 3770 (56%) | 4643 (53.5%) | |
1 | 2456 (31.1%) | 2049 (30.4%) | 2721 (31.4%) | |
>=2 | 966 (12.2%) | 918 (13.6%) | 1310 (15.1%) | |
Adenoma | 1697 (21.5%) | 1503 (22.3%) | 2059 (23.7%) | 0.002 |
Advanced Adenoma | 361 (4.6%) | 324 (4.8%) | 382 (4.4%) | 0.48 |
Cancer | 12 (0.2%) | 12 (0.2%) | 9 (0.1%) | 0.45 |
Disclosures:
Rajat Garg, MD1, Vidhi Patel, MD2, Amandeep Singh, MD1, Priya Sasankan, MD, MBA1, John McMichael, PhD1, Prashanthi Thota, MD3, Madhusudhan Sanaka, MD4. B0164 - Impact of COVID-19 on Trends and Healthcare Disparities on Utilization of Screening Colonoscopy, ACG 2022 Annual Scientific Meeting Abstracts. Charlotte, NC: American College of Gastroenterology.
