Back


Poster Session B - Monday Morning
Category: Stomach
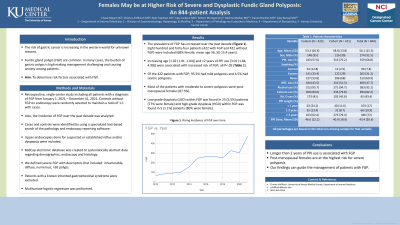
B0681 - Females May Be at Higher Risk of Severe and Dysplastic Fundic Gland Polyposis: An 844-Patient Analysis
Monday, October 24, 2022
10:00 AM – 12:00 PM ET
Location: Crown Ballroom

Has Audio

Charlie Altfillisch, MD
University of Kansas Medical Center
Kansas City, MO
Presenting Author(s)
Award: ACG/Radhika Srinivasan Gender-Based Research Award
Award: Presidential Poster Award
Chase L. Meyer, DO1, Charlie Altfillisch, MD2, Kyle Yuquimpo, DO3, Katy Jackson, MD, MPH4, Robert Montgomery, PhD1, Daniel C. Buckles, MD5, Rashna Madan, MBBS6, Ajay Bansal, MD7
1University of Kansas, Kansas City, KS; 2University of Kansas Medical Center, Kansas City, MO; 3University of Kansas Medical Center, Lenexa, KS; 4The University of Kansas Medical Center, Kansas City, KS; 5Kansas University, Kansas City, KS; 6Kansas University Medical Center, Kansas City, KS; 7University of Kansas Medical Center, Kansas City, KS
Introduction: The risk of gastric cancer is increasing in the western world for unknown reasons. Fundic gland polyps (FGP) are common. In many cases, the burden of gastric polyps is high making management challenging and causing anxiety among patients. We compared patients with and without FGP to determine potential risk factors associated with severe FGP.
Methods: In this retrospective, single-center study, all patients with a diagnosis of histologically confirmed fundic gland polyps between January 1, 2021, and December 31, 2021 were included. Controls were defined as patients without FGP during an upper endoscopy, selected randomly in a ratio of 1:1 to cases. Cases and controls were identified by using a specialized text-based search of the pathology and endoscopy reporting software. Upper endoscopies done for suspected or established reflux and/or dyspepsia were included. A structured RedCap electronic database was created to systematically abstract data about demographics, endoscopies, and histology. Severe FGP was defined by the presence of endoscopic descriptors such as “innumerable”, “diffuse”, ”numerous”, “many”, “ >50 polyps” etc., and confirmed by endoscopic pictures. Patients with a known inherited gastrointestinal syndrome were excluded. Multivariate logistic regression was performed.
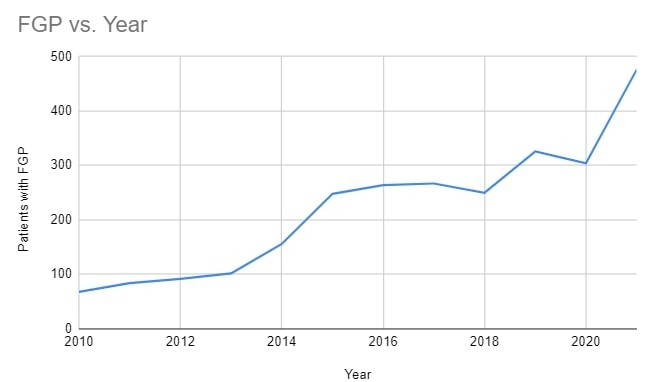
Results: The prevalence of FGP has increased over the past decade (Figure 1). Eight hundred and forty-four patients (422 with FGP and 422 without FGP) were included (68% female, mean age 56, SD 15.4 years). Increasing age (1.02 (1.01, 1.04)) and >2 years of PPI use [3.01 (1.84, 4.98)] were associated with increased risk of FGP; all P< .05 (Table 1). Of the 422 patients with FGP; 95.5% had mild polyposis and 4.5% had severe polyposis. Most of the patients with moderate to severe polyposis were post-menopausal females (87.5%). Low-grade dysplasia (LGD) within FGP was found in 25 (5.5%) patients (77% were female) and high-grade dysplasia (HGD) within FGP was found in 5 (1.1%) patients (80% were female).
Discussion: Longer than 2 years of PPI use is associated with FGP. Post-menopausal females were at the highest risk for severe polyposis. Further research into long-term outcomes is needed to determine which patients could benefit from surveillance.

Disclosures:
Chase L. Meyer, DO1, Charlie Altfillisch, MD2, Kyle Yuquimpo, DO3, Katy Jackson, MD, MPH4, Robert Montgomery, PhD1, Daniel C. Buckles, MD5, Rashna Madan, MBBS6, Ajay Bansal, MD7. B0681 - Females May Be at Higher Risk of Severe and Dysplastic Fundic Gland Polyposis: An 844-Patient Analysis, ACG 2022 Annual Scientific Meeting Abstracts. Charlotte, NC: American College of Gastroenterology.
Award: Presidential Poster Award
Chase L. Meyer, DO1, Charlie Altfillisch, MD2, Kyle Yuquimpo, DO3, Katy Jackson, MD, MPH4, Robert Montgomery, PhD1, Daniel C. Buckles, MD5, Rashna Madan, MBBS6, Ajay Bansal, MD7
1University of Kansas, Kansas City, KS; 2University of Kansas Medical Center, Kansas City, MO; 3University of Kansas Medical Center, Lenexa, KS; 4The University of Kansas Medical Center, Kansas City, KS; 5Kansas University, Kansas City, KS; 6Kansas University Medical Center, Kansas City, KS; 7University of Kansas Medical Center, Kansas City, KS
Introduction: The risk of gastric cancer is increasing in the western world for unknown reasons. Fundic gland polyps (FGP) are common. In many cases, the burden of gastric polyps is high making management challenging and causing anxiety among patients. We compared patients with and without FGP to determine potential risk factors associated with severe FGP.
Methods: In this retrospective, single-center study, all patients with a diagnosis of histologically confirmed fundic gland polyps between January 1, 2021, and December 31, 2021 were included. Controls were defined as patients without FGP during an upper endoscopy, selected randomly in a ratio of 1:1 to cases. Cases and controls were identified by using a specialized text-based search of the pathology and endoscopy reporting software. Upper endoscopies done for suspected or established reflux and/or dyspepsia were included. A structured RedCap electronic database was created to systematically abstract data about demographics, endoscopies, and histology. Severe FGP was defined by the presence of endoscopic descriptors such as “innumerable”, “diffuse”, ”numerous”, “many”, “ >50 polyps” etc., and confirmed by endoscopic pictures. Patients with a known inherited gastrointestinal syndrome were excluded. Multivariate logistic regression was performed.
Results: The prevalence of FGP has increased over the past decade (Figure 1). Eight hundred and forty-four patients (422 with FGP and 422 without FGP) were included (68% female, mean age 56, SD 15.4 years). Increasing age (1.02 (1.01, 1.04)) and >2 years of PPI use [3.01 (1.84, 4.98)] were associated with increased risk of FGP; all P< .05 (Table 1). Of the 422 patients with FGP; 95.5% had mild polyposis and 4.5% had severe polyposis. Most of the patients with moderate to severe polyposis were post-menopausal females (87.5%). Low-grade dysplasia (LGD) within FGP was found in 25 (5.5%) patients (77% were female) and high-grade dysplasia (HGD) within FGP was found in 5 (1.1%) patients (80% were female).
Discussion: Longer than 2 years of PPI use is associated with FGP. Post-menopausal females were at the highest risk for severe polyposis. Further research into long-term outcomes is needed to determine which patients could benefit from surveillance.

Figure: Temporal trends of FGP
All percentages are based on the total non-missing sample for that variable.
P-values are based on t-tests for continuous variables, tests of proportions of dichotomous variables and chi-square tests for categorical variables with more than 2 categories.
Disclosures:
Chase Meyer indicated no relevant financial relationships.
Charlie Altfillisch indicated no relevant financial relationships.
Kyle Yuquimpo indicated no relevant financial relationships.
Katy Jackson indicated no relevant financial relationships.
Robert Montgomery indicated no relevant financial relationships.
Daniel Buckles indicated no relevant financial relationships.
Rashna Madan indicated no relevant financial relationships.
Ajay Bansal: Freenome – Grant/Research Support. Stella Diagnostics – Consultant, Grant/Research Support.
Chase L. Meyer, DO1, Charlie Altfillisch, MD2, Kyle Yuquimpo, DO3, Katy Jackson, MD, MPH4, Robert Montgomery, PhD1, Daniel C. Buckles, MD5, Rashna Madan, MBBS6, Ajay Bansal, MD7. B0681 - Females May Be at Higher Risk of Severe and Dysplastic Fundic Gland Polyposis: An 844-Patient Analysis, ACG 2022 Annual Scientific Meeting Abstracts. Charlotte, NC: American College of Gastroenterology.

