Poster Session C - Monday Afternoon
Category: Interventional Endoscopy
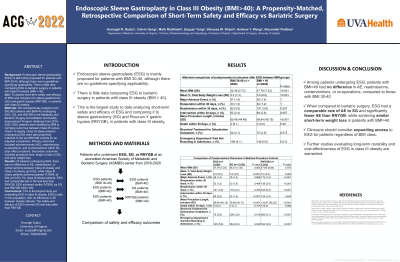
C0451 - Endoscopic Sleeve Gastroplasty in Class III Obesity (BMI>40): A Propensity-Matched, Retrospective Comparison of Short-Term Safety and Efficacy vs Bariatric Surgery


Anuragh Gudur, MD
University of Virginia
Charlottesville, VA
Presenting Author(s)
Anuragh Gudur, MD, Calvin Geng, MD, Mark Radlinski, MD, Vanessa Shami, MD, Andrew Wang, MD, Alexander Podboy, MD
University of Virginia, Charlottesville, VA
Introduction: Less than 1% of eligible patients undergo bariatric surgery, mainly due to apprehensions over adverse events. Endoscopic sleeve gastroplasty (ESG) may increase adoption of bariatric procedures while limiting potential procedural morbidity. Although there are no guidelines that specify applicability, ESG is still predominantly offered to patients with class I (BMI 30-35 kg/m2) and class II obesity (BMI 35-40 kg/m2). There is a lack of data evaluating ESG amongst its surgical bariatric alternatives in patients with class III obesity (BMI > 40 kg/m2). This is the largest study yet to assess short term (30d) safety and efficacy of ESG in patients with class III obesity and compare its performance to sleeve gastrectomy (SG) and Roux-en-Y bypass (RNYB).
Methods: We retrospectively evaluated over 500,000 patients undergoing ESG, SG, and RNYB across 800 hospitals from the Metabolic and Bariatric Surgery Accreditation and Quality Improvement Program (MBSAQIP) database from 2016-2020. ESG patients were grouped by obesity class (Class III and Class I-II) and propensity matched to compare outcomes between groups. ESG patients with class III obesity were also propensity matched separately to SG and RNYB patients with class III obesity to compare outcomes. Outcomes measured at 30d included adverse events (AE), readmissions, reoperations, reinterventions, total body weight loss (TBWL), emergency room (ER) visits, and outpatient treatments for dehydration.
Results: In patients who underwent ESG, there was no difference in AE, readmissions, reoperations, or reinterventions between Class III and Class I-II obesity cohorts (p >0.05). ESG led to greater mean %TBWL at 30d in Class III obesity versus Class I-II obesity (p< 0.05). For class III obese patients, ESG had similar AE to SG (p >0.05) and far less than RNYB (p< 0.05). ESG led to nearly identical mean %TBWL as SG and RNYB at 30d (p< 0.05). ESG patients had similar rates of readmissions and reoperations (p >0.05) compared to SG, but more reinterventions (p < 0.05). SG had more outpatient treatments for dehydration (p< 0.05) and ER visits (p< 0.05) than ESG. Compared to RNYB, ESG had fewer readmissions, reoperations, outpatient treatments for dehydration, and ER visits (p< 0.05).
Discussion: ESG is safe in class III obesity, with no difference in AE between obesity classes. The safety of ESG in class III obesity mirrored SG and exceeded RNYB, with comparable efficacy. Clinicians should consider expanding access to ESG regardless of BMI.
Short-Term Safety and Efficacy of Endoscopic Sleeve Gastroplasty in Class III Obesity versus Bariatric Surgery | |||||||
| ESG in Class III (n= 2,626) | ESG in Class I-II Obesity | P | SG in Class III | P | RNYB in Class III | P |
Mean BMI (SD) | 47.79 (7.23) | 35.38 (2.73) | < 0.001 | 48.31 (7.44) | 0.003 | 47.85 (6.84) | 0.707 |
Mean Change from Pre-Op to Post-Op BMI (SD) | -2.44 (3.42) | -1.30 (1.84) | < 0.001 | -2.65 (2.29) | 0.002 | -2.58 (2.47) | 0.057 |
Mean % Total Body Weight Loss at 30d (SD) | 5.0 (6.0) | 3.2 (7.3) | < 0.001 | 5.4 (3.8) | < 0.001 | 5.3 (4.4) | 0.003 |
Mean Number of Days from Procedure to Discharge (SD) | 1.01 (1.65) | 0.73 (2.23) | < 0.001 | 1.52 (1.33) | < 0.001 | 1.94 (1.84) | < 0.001 |
Mean Procedure Length, minutes (SD) | 68.94 (49.15) | 60.49 (44.48) | < 0.001 | 78.99 (40.17) | < 0.001 | 134.97 (65.25) | < 0.001 |
Major Adverse Event, n (%) | 36 (1.4) | 37 (1.4) | 1 | 76 (1.4) | 0.866 | 172 (3.3) | < 0.001 |
Anastomotic Leak, n (%) | 0 (0.0) | 0 (0.0) | 1 | 1 (0.2) | 0.808 | 2 (0.3) | 0.718 |
Pneumonia, n (%) | 2 (0.1) | 7 (0.3) | 0.182 | 9 (021) | 0.784 | 24 (0.5) | 0.01 |
Intra-operative or Post-operative Blood Transfusion, n (%) | 11 (0.4) | 15 (0.6) | 0.555 | 25 (0.5) | 0.859 | 68 (1.3) | < 0.001 |
Mean Number of Blood Products Transfused (SD) | 0.11 (0.87) | 0.10 (0.56) | 0.965 | 0.10 (0.56) | 0.835 | 0.25 (1.05) | 0.017 |
Vein Thrombosis requiring therapy, n (%) | 0 (0.0) | 2 (0.1) | 0.479 | 12 (0.2) | 0.032 | 10 (0.2) | 0.057 |
Sepsis, n (%) | 6 (0.2) | 6 (0.2) | 1 | 7 (0.1) | 0.492 | 13 (0.2) | 1 |
Unplanned Admission to ICU, n (%) | 12 (0.5) | 9 (0.3) | 0.662 | 29 (0.6) | 0.698 | 58 (1.1) | 0.006 |
Bowel Obstruction, n (%) | 1 (0.3) | 0 (0.0) | 1 | 2 (0.0) | 0.883 | 6 (0.9) | 0.383 |
Reoperation within 30 days, n (%) | 32 (1.2) | 33 (1.3) | 1 | 53 (1.0) | 0.464 | 138 (2.6) | < 0.001 |
Readmission within 30 days, n (%) | 101 (3.8) | 92 (3.5) | 0.557 | 179 (3.4) | 0.355 | 334 (6.4) | < 0.001 |
Reintervention within 30 days, n (%) | 68 (2.6) | 62 (2.4) | 0.657 | 53 (1.0) | < 0.001 | 125 (2.4) | 0.624 |
Received Treatment for Dehydration Outpatient, n (%) | 75 (2.9) | 54 (2.1) | 0.075 | 206 (3.9) | 0.019 | 269 (5.1) | < 0.001 |
Emergency Department Visit Not Resulting in Admission, n (%) | 148 (5.6) | 108 (4.1) | 0.012 | 364 (6.9) | 0.032 | 522 (9.9) | < 0.001 |
Disclosures:
Anuragh Gudur, MD, Calvin Geng, MD, Mark Radlinski, MD, Vanessa Shami, MD, Andrew Wang, MD, Alexander Podboy, MD. C0451 - Endoscopic Sleeve Gastroplasty in Class III Obesity (BMI>40): A Propensity-Matched, Retrospective Comparison of Short-Term Safety and Efficacy vs Bariatric Surgery, ACG 2022 Annual Scientific Meeting Abstracts. Charlotte, NC: American College of Gastroenterology.


