Poster Session D - Tuesday Morning
Category: IBD
D0387 - Safety and Efficacy of Endoscopic Dilation of Small Bowel Crohn’s Disease Strictures via Ileostomy


Mihir S. Patel, MD, MBA
Cleveland Clinic
Cleveland, OH
Presenting Author(s)
1Cleveland Clinic, Cleveland, OH; 2UPMC, Pittsburgh, PA; 3Cleveland Clinic Foundation, Cleveland, OH; 4Cleveland Clinic Abu Dhabi, Al Maryah Island, Abu Dhabi, United Arab Emirates; 5Lerner Research Institute, Cleveland Clinic Foundation, Cleveland, OH
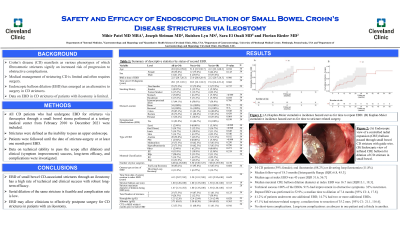
Introduction: Crohn’s disease (CD) manifests as a variety of phenotypes of which fibrostenotic strictures signify an increased risk of progression to obstructive complications. Medical management of stricturing CD is limited and often requires surgical interventions. Endoscopic balloon dilation (EBD) has emerged as an alternative to surgery in CD strictures. Data on EBD in CD strictures of patients with ileostomy is limited.
Methods: All CD patients who had undergone EBD for strictures via ileoscopies through a small bowel stoma performed at a tertiary medical center from February 2010 to December 2021 were included. Strictures were defined as the inability to pass an upper endoscope. Patients were followed until the date of stricture-related surgery or at least one month post EBD. Data on technical (ability to pass the scope after dilation) and clinical (symptom improvement) success, long-term efficacy, and complications were investigated.
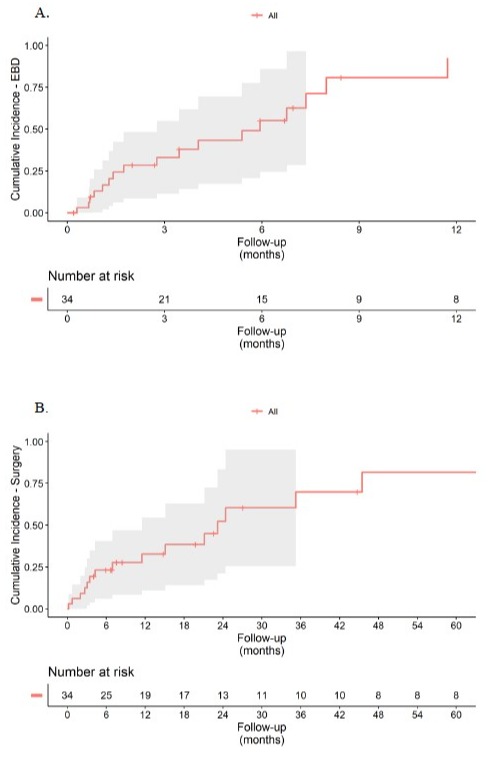
Results: In total, 34 CD patients (59% female) with end ileostomies (88.2%) or diverting loop ileostomies (11.8%) were identified with a median follow-up of 18.3 months [Interquartile Range (IQR) 6.8, 45.3]. Median age at index EBD was 45 years [IQR 31.6, 56.7] The median maximal balloon dilation diameter at index EBD was 16.7 mm [IQR13.1, 18.3]. Technical success was achieved in 100% of the EBDs, with 91% of patients endorsing clinical success (improvement in symptoms). Obstructive symptoms recurred in 32% of patients. Repeat EBD was performed in 52.9% with a median time to dilation of 7.4 months [95% CI: 4, 17.8]. Furthermore, 41.2% of patients underwent one additional EBD and 14.7% had two or more additional EBDs. During follow-up, 47.1% underwent stricture-related surgery with a median time to resection of 35.2 months [95% C1: 21.1, 116.6]. There were no short-term complications within a week however long-term complications included an abscess in one patient and a fistula in another patient.
Discussion: EBD of small bowel CD-associated strictures through an ileostomy has a high rate of technical and clinical success with robust long-term efficacy. Serial dilation of the same stricture is feasible and the complication rate is low. EBD may allow clinicians to effectively postpone surgery for CD strictures in patients with an ileostomy.

Variable | Level | All (n=34) | No (n=16) | Yes (n=18) | P-value | N |
Age |
| 45.0 [31.6;59.0] | 51.8 [31.9;56.7] | 41.3 [32.1;60.2] | 0.918 | 34 |
Sex | Female | 20 (58.8%) | 12 (75.0%) | 8 (44.4%) | 0.145 | 34 |
Male | 14 (41.2%) | 4 (25.0%) | 10 (55.6%) |
|
| |
BMI at time of EBD |
| 22.5 [20.7;26.3] | 23.0 [20.8;26.4] | 22.2 [20.7;26.3] | 0.986 | 34 |
Time since CD diagnosis (years) |
| 20.1 [15.1;32.1] | 20.3 [16.1;34.3] | 19.4 [14.4;31.4] | 0.666 | 34 |
Smoking History | Non-Smoker | 25 (73.5%) | 12 (75.0%) | 13 (72.2%) | 0.737 | 34 |
Smoker | 3 (8.82%) | 2 (12.5%) | 1 (5.56%) |
|
| |
Former Smoker | 6 (17.6%) | 2 (12.5%) | 4 (22.2%) |
|
| |
Disease Location | Stomach | 2 (5.88%) | 1 (6.25%) | 1 (5.56%) | >0.999 | 34 |
Duodenum | 6 (17.6%) | 5 (31.2%) | 1 (5.56%) | 0.078 | 34 | |
Jejunum/proximal ileum | 15 (44.1%) | 8 (50.0%) | 7 (38.9%) | 0.760 | 34 | |
Ileum | 34 (100%) | 16 (100%) | 18 (100%) | N/A | 34 | |
Ileocecal | 34 (100%) | 16 (100%) | 18 (100%) | N/A | 34 | |
Colon | 29 (85.3%) | 13 (81.2%) | 16 (88.9%) | 0.648 | 34 | |
Rectum | 26 (76.5%) | 11 (68.8%) | 15 (83.3%) | 0.429 | 34 | |
Perianal | 13 (38.2%) | 3 (18.8%) | 10 (55.6%) | 0.064 | 34 | |
Extraintestinal Manifestations (EIM) | Yes | 31 (93.9%) | 13 (86.7%) | 18 (100%) | 0.199 | 34 |
Type of EIM | Eyes) | 1 (2.94%) | 0 (0.00%) | 1 (5.56%) | >0.999 | 34 |
Oral Ulcers) | 5 (14.7%) | 2 (12.5%) | 3 (16.7%) | >0.999 | 34 | |
Joints | 5 (14.7%) | 3 (18.8%) | 2 (11.1%) | 0.648 | 34 | |
Skin | 5 (14.7%) | 1 (6.25%) | 4 (22.2%) | 0.340 | 34 | |
Anemia | 20 (58.8%) | 7 (43.8%) | 13 (72.2%) | 0.182 | 34 | |
PSC | 1 (2.94%) | 0 (0.00%) | 1 (5.56%) | >0.999 | 34 | |
Malnutrition | 25 (73.5%) | 10 (62.5%) | 15 (83.3%) | 0.250 | 34 | |
Hypoalbuminemia | 25 (73.5%) | 10 (62.5%) | 15 (83.3%) | 0.250 | 34 | |
Other | 1 (2.94%) | 1 (6.25%) | 0 (0.00%) | 0.471 | 34 | |
Montreal Classification | B2 | 4 (11.8%) | 3 (18.8%) | 1 (5.56%) | 0.219 | 34 |
B2p | 7 (20.6%) | 5 (31.2%) | 2 (11.1%) |
| 34 | |
B3 | 5 (14.7%) | 1 (6.25%) | 4 (22.2%) |
|
| |
B3p | 18 (52.9%) | 7 (43.8%) | 11 (61.1%) |
|
| |
Number of prior surgeries |
| 6.00 [4.25;8.00] | 5.50 [3.50;7.25] | 7.00 [5.25;9.50] | 0.150 |
|
End Loop Ileostomy | 30 (88.2%) | 15 (93.8%) | 15 (83.3%) | 0.604 | 34 | |
Diverting Loop Ileostomy | 4 (11.8%) | 1 (6.25%) | 3 (16.7%) |
|
| |
Time from date of ostomy creation to index EBD (years) |
| 4.13 [2.07;7.02] | 3.20 [1.91;7.80] | 4.33 [2.95;6.90] | 0.629 | 34 |
Stricture balloon size (cm) |
| 1.80 [1.20;2.00] | 1.80 [1.35;2.00] | 1.50 [1.20;1.80] | 0.315 | 19 |
Stricture maximum diameter of dilation during EBD (cm) |
| 1.67 [1.31;1.83] | 1.80 [1.35;2.00] | 1.50 [1.20;1.80] | 0.315 | 28 |
Total Number of strictures | 1 | 25 (73.5%) | 14 (87.5%) | 11 (61.1%) | 0.125 | 34 |
2 | 9 (26.5%) | 2 (12.5%) | 7 (38.9%) |
|
| |
Hemoglobin (g/dL) |
| 12.5 (2.26) | 12.4 (2.04) | 12.6 (2.49) | 0.828 | 23 |
Albumin (g/dL) |
| 3.71 (0.65) | 3.58 (0.38) | 3.84 (0.82) | 0.365 | 21 |
CTE or MRE within 6 months prior to Index EBD |
| 12 (35.3%) | 11 (68.8%) | 11 (61.1%) | 0.916 | 34 |
Disclosures:
Mihir S. Patel, MD, MBA1, Joseph Sleiman, MD2, Ruishen Lyu, MS3, Sara El Ouali, MD4, Florian Rieder, MD5. D0387 - Safety and Efficacy of Endoscopic Dilation of Small Bowel Crohn’s Disease Strictures via Ileostomy, ACG 2022 Annual Scientific Meeting Abstracts. Charlotte, NC: American College of Gastroenterology.
