Poster Session E - Tuesday Afternoon
Category: Biliary/Pancreas
E0023 - Pre-Existing, Early Onset and Late Onset Diabetes in Chronic Pancreatitis: Do Outcomes Differ?


Shaharyar Zuberi, MD
Beth Israel Deaconess Medical Center, Harvard Medical School
Boston, MA
Presenting Author(s)
1Beth Israel Deaconess Medical Center, Harvard Medical School, Boston, MA; 2Duke University Medical Center, Durahm, NC
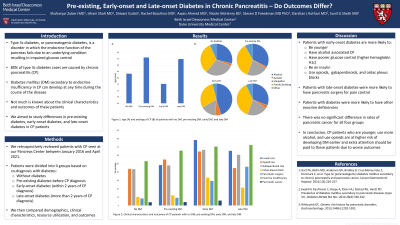
Introduction: Diabetes secondary to endocrine insufficiency in chronic pancreatitis (CP) may develop at any time during the course of the disease. Not much is known about the clinical characteristics and outcomes in these patients. Hence we sought to evaluate differences in pre-existing diabetes, early-onset diabetes, and late-onset diabetes in CP patients.
Methods: We retrospectively reviewed CP patients seen at our Pancreas Center between 2016 and 2021. We divided the patients into four groups based on a co-diagnosis of diabetes: those without diabetes, those with pre-existing diabetes (more than 2 years before CP diagnosis), those with early-onset diabetes (diagnosed within 2 years before or 2 years after CP diagnosis), and those with late-onset diabetes (diagnosed 2 years after CP diagnosis). Patients with diabetes after surgery were excluded. We then compared the clinical characteristics, parameters of glucose control, and outcomes.
Results: We identified 450 patients with CP: 271 without diabetes, 99 with pre-existing diabetes, 51 with early-onset diabetes and 29 with late-onset diabetes. Early-onset diabetes patients were younger (54.1 vs 57.3 vs 62.5 vs 61.9 years) and more likely to have alcohol-related CP (45.1% vs 31.7% vs 32.3% vs 31%) compared to the other three groups (p< 0.05). Early-onset diabetics had a higher mean HbA1C level (8.02% vs 5.11% vs 7.71% vs 7.66%) and were more likely to be on insulin (78.4% vs 0% vs 48.4% vs 65.5%, p< 0.05). Early-onset diabetics used more opioids (64.7% vs 43.9% vs 55.1% vs 44.8%) and gabapentinoids (66.7% vs 43.5% vs 48% vs 60.7%) compared to other groups (p< 0.05). Patients who developed diabetes after the diagnosis of CP had significantly higher rates of exocrine insufficiency, anatomical complications and interventions for pain control. Other demographics and common complications are outlined in Table 1. There was no significant difference in pancreatic cancer in the four groups (p=0.7).
Discussion: Our study suggests that CP patients who are younger and use alcohol, are at higher risk of having early-onset diabetes after CP diagnosis. This population should be screened earlier as they have poorer glucose control and higher insulin requirement compared those with pre-existing and late-onset diabetes. Also, patients who develop diabetes after CP diagnosis have worse outcomes and use more resources. Long-term prospective studies are needed to generate more robust data.
| No diabetes N=271 | Pre-existing diabetes N=99 | Early-onset diabetes (< 2 years) N=51 | Late-onset diabetes ( >2years) N=29 | P-value |
|
|
|
|
|
|
Mean age in years (SD) | 57.3 (16.0) | 62.5 (12.8) | 54.1 (13.5) | 61.9 (11.5) | 0.002 |
Mean age at diagnosis of CP (SD) | 45.0 (16.2) | 53.0 (14.5) | 41.2 (15.5) | 47.8 (13.4) | < 0.001 |
Female sex (%) | 133 (49.6%) | 43 (43.4%) | 22 (43.1%) | 13 (44.8%) | 0.659 |
White race (%) | 201 (75.6%) | 71 (71.7%) | 34 (66.7%) | 24 (82.8%) | 0.34 |
Mean number of follow up years in pancreas center | 7.84 (5.36) | 7.86 (6.68) | 8.74 (5.49) | 12.1 (5.05) | 0.004 |
Etiology of CP: |
|
|
|
| < 0.001 |
Alcohol | 86 (31.7%) | 32 (32.3%) | 23 (45.1%) | 9 (31.0%) | |
Genetic | 8 (2.95%) | 2 (2.02%) | 3 (5.88%) | 1 (3.45%) | |
Idiopathic | 88 (32.5%) | 21 (21.2%) | 8 (15.7%) | 6 (20.7%) | |
Smoking | 69 (25.5%) | 36 (36.4%) | 15 (29.4%) | 11 (37.9%) |
|
Other | 20 (7.38%) | 8 (8.08%) | 2 (3.92%) | 2 (6.90%) |
|
History of recurrent acute pancreatitis (%) | 214 (78%) | 69 (69.6%) | 35 (68.6%) | 21 (72.4%) | 0.943 |
Chronic abdominal pain (%) | 205 (79.2%) | 80 (80.8%) | 48 (94.1%) | 23 (79.3%) | 0.094 |
Splanchnic vein thrombosis (%) | 22 (8.43%) | 15 (15.3%) | 7 (13.7%) | 8 (27.6%) | 0.013 |
Pseudocyst (%) | 81 (30.9%) | 39 (39.8%) | 25 (49.0%) | 14 (48.3%) | 0.027 |
Biliary obstruction (%) | 30 (11.7%) | 22 (22.7%) | 9 (17.6%) | 7 (24.1%) | 0.031 |
Vitamin D deficiency (%) | 78 (32.1%) | 45 (51.7%) | 23 (48.9%) | 20 (83.3%) | < 0.001 |
Mean Hba1c Level (SD) | 5.11 (1.15) | 7.71 (1.38) | 8.02 (1.61) | 7.66 (0.98) | < 0.001 |
On insulin (%) | 0 | 48 (48.4%) | 40 (78.4%) | 19 (65.5%) | < 0.001 |
Pancreatic malignancy (%) | 10 (3.88%) | 4 (4.08%) | 3 (5.88%) | 0 (0.00%) | 0.709 |
Exocrine pancreatic insufficiency (%) | 144 (53.1%) | 65 (65.7%) | 36 (70.6%) | 21 (72.4%) | 0.014 |
Opioid use (%) | 116 (43.9%) | 54 (55.1%) | 33 (64.7%) | 13 (44.8%) | 0.024 |
Non-opioid controlled medications (%) | 63 (24.0%) | 32 (32.7%) | 17 (33.3%) | 10 (34.5%) | 0.220 |
Gabapentinoid use (%) | 114 (43.5%) | 47 (48.0%) | 34 (66.7%) | 17 (60.7%) | 0.012 |
Medical marijuana use (%) | 19 (7.66%) | 8 (8.60%) | 9 (18.8%) | 3 (10.7%) | 0.120 |
Mean number of flares requiring hospitalization (SD) | 2.02 (3.42) | 2.55 (3.18) | 3.06 (3.44) | 2.41 (3.39) | 0.202 |
Recurrent ED visits (%) | 15 (5.75%) | 9 (9.18%) | 4 (8.00%) | 2 (6.90%) | 0.617 |
Mean total abdominal imaging since diagnosis (SD) | 4.28 (3.60) | 5.64 (4.53) | 7.49 (6.43) | 7.28 (4.52) | < 0.001 |
Celiac block for pain (%) | 27 (10.3%) | 12 (12.2%) | 17 (33.3%) | 6 (21.4%) | < 0.001 |
Pancreatic surgery for pain (%) | 22 (8.43%) | 9 (9.18%) | 15 (29.4%) | 13 (46.4%) | < 0.001 |
Disclosures:
Shaharyar Zuberi, MD1, Ishani Shah, MD1, Shivani Gulati, 1, Rachel Bocchino, MD1, Awais Ahmed, MD1, Nicole McHenry, BS1, Steven Freedman, MD, PhD1, Darshan Kothari, MD2, Sunil G. Sheth, MD1. E0023 - Pre-Existing, Early Onset and Late Onset Diabetes in Chronic Pancreatitis: Do Outcomes Differ?, ACG 2022 Annual Scientific Meeting Abstracts. Charlotte, NC: American College of Gastroenterology.

