Back


Poster Session B - Monday Morning
Category: Biliary/Pancreas
B0023 - African Americans With Pancreatic Adenocarcinoma Have Higher Inpatient Mortality at a Younger Age: A Nationwide Inpatient Sample Study
Monday, October 24, 2022
10:00 AM – 12:00 PM ET
Location: Crown Ballroom

Has Audio

Yash Shah, MD
Hackensack Meridian Ocean Medical Center
Brick, NJ
Presenting Author(s)
Yash Shah, MD1, Mina Aknouk, MD2, Pooja Shah, MBBS, MS3, Pranav D. Patel, MD4, Pramil Cheriyath, MD, MS2, Milin Shah, MS5, Devina Adalja, MD6, Kirtenkumar Patel, MD7, Dhruvan Patel, MD8
1Hackensack, Aberdeen, NJ; 2Ocean University Medical Center, Brick, NJ; 3Baroda Medical College, Brick, NJ; 4Geisinger Medical Center, Danville, PA; 5Aberdeen, NJ; 6St. Joseph's University Center, Paterson, NJ; 7St. Mary Medical Center, Fairless Hills, PA; 8Mercey Fitzgerald Hospital, Darby, PA
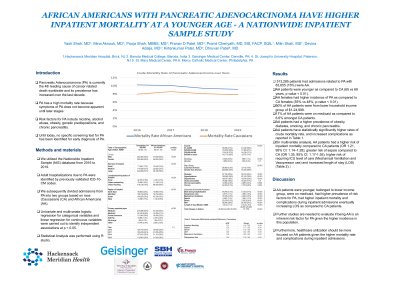
Introduction: Pancreatic Adenocarcinoma (PA) is currently the 4th leading cause of cancer related death worldwide and its prevalence has increased over the last decade. PA has a high mortality rate because symptoms of PA does not become apparent until later stages. Risk factors for PA include nicotine, alcohol abuse, obesity, genetic predispositions, and chronic pancreatitis. Until today, no specific screening test for PA has been identified for early diagnosis of PA.
Methods: We utilized the Nationwide Inpatient Sample (NIS) database from 2016 to 2019. Adult hospitalizations due to PA were identified by previously validated ICD-10-CM codes. We subsequently divided admissions from PA into two groups based on race (Caucasians (CA) and African Americans (AA). Univariate and multivariate logistic regression for categorical variables and linear regression for continuous variables were carried out to identify independent associations at p < 0.05. Statistical Analysis was performed using R studio.
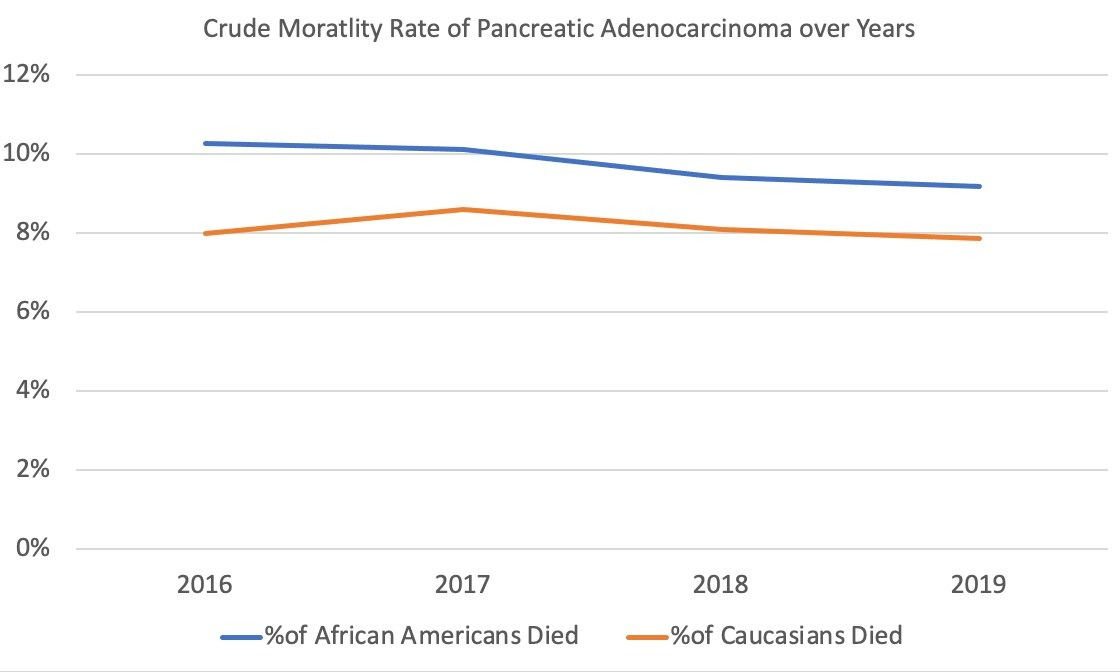
Results: 513,285 patients had admissions related to PA with 83,655 (16%) were AA. AA patients were younger as compared to CA (65 vs 69 years, p value < 0.01). AA females had higher incidence of PA as compared to CA females (55% vs 48%, p-value < 0.01). 50% of AA patients were from lower household income group of $1-24,999. 17% of AA patients were on medicaid as compared to 6.6% amongst CA patients. AA patients had a higher prevalence of obesity, diabetes, smoking, and chronic pancreatitis. AA patients have statistically significantly higher rates of crude mortality rate, and increased complications as reported in Table 1. On multivariate analysis, AA patients had a higher risk of inpatient mortality compared to CA patients (OR 1.21, 95% CI: 1.14–1.28); greater risk of sepsis compared to CA (OR 1.35, 95% CI: 1.17-1.55); higher risk of requiring ICU level of care (Mechanical Ventilation and Vasopressor use) and increased length of stay (LOS) (Table 2).
Discussion: AA patients were younger, belonged to lower income group, were on medicaid, had higher prevalence of risk factors for PA, had higher inpatient mortality and complications during inpatient admissions eventually increasing LOS as compared to CA patients.
Further studies are needed to evaluate if being AA is an inherent risk factor for PA given the higher incidence in this population. Furthermore, healthcare utilization should be more focused on AA patients given the higher mortality rate and complications during inpatient admissions.

Disclosures:
Yash Shah, MD1, Mina Aknouk, MD2, Pooja Shah, MBBS, MS3, Pranav D. Patel, MD4, Pramil Cheriyath, MD, MS2, Milin Shah, MS5, Devina Adalja, MD6, Kirtenkumar Patel, MD7, Dhruvan Patel, MD8. B0023 - African Americans With Pancreatic Adenocarcinoma Have Higher Inpatient Mortality at a Younger Age: A Nationwide Inpatient Sample Study, ACG 2022 Annual Scientific Meeting Abstracts. Charlotte, NC: American College of Gastroenterology.
1Hackensack, Aberdeen, NJ; 2Ocean University Medical Center, Brick, NJ; 3Baroda Medical College, Brick, NJ; 4Geisinger Medical Center, Danville, PA; 5Aberdeen, NJ; 6St. Joseph's University Center, Paterson, NJ; 7St. Mary Medical Center, Fairless Hills, PA; 8Mercey Fitzgerald Hospital, Darby, PA
Introduction: Pancreatic Adenocarcinoma (PA) is currently the 4th leading cause of cancer related death worldwide and its prevalence has increased over the last decade. PA has a high mortality rate because symptoms of PA does not become apparent until later stages. Risk factors for PA include nicotine, alcohol abuse, obesity, genetic predispositions, and chronic pancreatitis. Until today, no specific screening test for PA has been identified for early diagnosis of PA.
Methods: We utilized the Nationwide Inpatient Sample (NIS) database from 2016 to 2019. Adult hospitalizations due to PA were identified by previously validated ICD-10-CM codes. We subsequently divided admissions from PA into two groups based on race (Caucasians (CA) and African Americans (AA). Univariate and multivariate logistic regression for categorical variables and linear regression for continuous variables were carried out to identify independent associations at p < 0.05. Statistical Analysis was performed using R studio.
Results: 513,285 patients had admissions related to PA with 83,655 (16%) were AA. AA patients were younger as compared to CA (65 vs 69 years, p value < 0.01). AA females had higher incidence of PA as compared to CA females (55% vs 48%, p-value < 0.01). 50% of AA patients were from lower household income group of $1-24,999. 17% of AA patients were on medicaid as compared to 6.6% amongst CA patients. AA patients had a higher prevalence of obesity, diabetes, smoking, and chronic pancreatitis. AA patients have statistically significantly higher rates of crude mortality rate, and increased complications as reported in Table 1. On multivariate analysis, AA patients had a higher risk of inpatient mortality compared to CA patients (OR 1.21, 95% CI: 1.14–1.28); greater risk of sepsis compared to CA (OR 1.35, 95% CI: 1.17-1.55); higher risk of requiring ICU level of care (Mechanical Ventilation and Vasopressor use) and increased length of stay (LOS) (Table 2).
Discussion: AA patients were younger, belonged to lower income group, were on medicaid, had higher prevalence of risk factors for PA, had higher inpatient mortality and complications during inpatient admissions eventually increasing LOS as compared to CA patients.
Further studies are needed to evaluate if being AA is an inherent risk factor for PA given the higher incidence in this population. Furthermore, healthcare utilization should be more focused on AA patients given the higher mortality rate and complications during inpatient admissions.

Figure: Figure 1. Trend of Crude Mortality Rate AA vs CA Over Years
| Table 1: | Demographics | Caucasians, N = 429,630 | African American, N = 83,655 | p-value |
| Age (median, IQR)# | 69 (61, 77) | 65 (57, 73) | < 0.001 | |
| Gender | ||||
| Male | 224,055 (52%) | 37,600 (45%) | < 0.001 | |
| Female | 205,365 (48%) | 46,025 (55%) | ||
| Bed size of hospital | < 0.001 | |||
| Small | 71,650 (17%) | 12,645 (15%) | ||
| Medium | 114,000 (27%) | 22,825 (27%) | ||
| Large | 243,980 (57%) | 48,185 (58%) | ||
| Location/teaching status of hospital | < 0.001 | |||
| Rural | 32,705 (7.6%) | 3,130 (3.7%) | ||
| Urban nonteaching | 78,820 (18%) | 11,105 (13%) | ||
| Urban Teaching | 318,105 (74%) | 69,420 (83%) | ||
| Region of hospital | < 0.001 | |||
| North East | 99,065 (23%) | 15,995 (19%) | ||
| Mid West | 106,150 (25%) | 16,730 (20%) | ||
| South | 149,825 (35%) | 43,785 (52%) | ||
| West | 74,590 (17%) | 7,145 (8.5%) | ||
| Primary expected payer | < 0.001 | |||
| Medicare | 272,095 (63%) | 44,435 (53%) | ||
| Medicaid | 28,140 (6.6%) | 14,355 (17%) | ||
| Private Insurance | 111,945 (26%) | 19,445 (23%) | ||
| Self Pay | 6,095 (1.4%) | 2,475 (3.0%) | ||
| No charge | 460 (0.1%) | 185 (0.2%) | ||
| Other | 10,440 (2.4%) | 2,655 (3.2%) | ||
| Year | 0.1 | |||
| 2016 | 104,140 (24%) | 19,640 (23%) | ||
| 2017 | 105,230 (24%) | 21,055 (25%) | ||
| 2018 | 107,615 (25%) | 21,115 (25%) | ||
| 2019 | 112,645 (26%) | 21,845 (26%) | ||
| Income | < 0.001 | |||
| $1-24,999 | 89,490 (21%) | 41,545 (50%) | ||
| $25,000-34,999 | 110,250 (26%) | 17,365 (21%) | ||
| $35,000-44,999 | 113,410 (27%) | 14,030 (17%) | ||
| $45,000 or more | 110,175 (26%) | 9,375 (11%) | ||
| Smoking | 3,350 (0.8%) | 960 (1.1%) | < 0.001 | |
| Alcohol | 1,650 (0.4%) | 305 (0.4%) | 0.7 | |
| Age Group | < 0.001 | |||
| Less than 50 Years | 26,965 (6.3%) | 8,710 (10%) | ||
| Greater than 50 years | 402,665 (94%) | 74,945 (90%) | ||
| Diabetes | 87,750 (20%) | 20,015 (24%) | < 0.001 | |
| Hyperlipidemia | 154,550 (36%) | 25,120 (30%) | < 0.001 | |
| Hypertension | 69,070 (16%) | 19,040 (23%) | < 0.001 | |
| Acute pancreatitis | 76,280 (18%) | 14,620 (17%) | 0.4 | |
| Chronic pancreatitis | 12,085 (2.8%) | 2,665 (3.2%) | 0.008 | |
| Obesity | 34,950 (8.1%) | 7,375 (8.8%) | 0.003 | |
| Table 2: | Outcomes (Univariate Analysis) | |||
| Died during hospitalization | 34,945 (8.1%) | 8,135 (9.7%) | < 0.001 | |
| Vasopressor_Use | 4,915 (1.1%) | 1,260 (1.5%) | < 0.001 | |
| Mechanical_Ventilation | 10,545 (2.5%) | 2,945 (3.5%) | < 0.001 | |
| Sepsis | 5,460 (1.3%) | 1,455 (1.7%) | < 0.001 | |
| Shock | 23,630 (5.5%) | 5,525 (6.6%) | < 0.001 | |
| AKI* | 85,350 (20%) | 22,750 (27%) | < 0.001 | |
| Length of stay (Median, IQR)# | 4.0 (3.0, 7.0) | 5.0 (3.0, 9.0) | < 0.001 | |
| Total Charges in Dollars | 45,284 (24,252, 85,750) | 48,805 (25,838, 91,718) | < 0.001 | |
| Table 3: | Outcomes (Multivariate analysis) | Reference: Caucasians | ||
| aOR | Range | p-value | ||
| Inpatient Mortality | 1.21 | 1.14-1.28 | < 0.01 | |
| Sepsis | 1.35 | 1.17-1.55 | < 0.01 | |
| Shock | 1.2 | 1.12-1.29 | < 0.01 | |
| AKI* | 1.49 | 1.43-1.56 | < 0.01 | |
| Mechanical Ventilation | 1.35 | 1.23-1.49 | < 0.01 | |
| Vasopressor Use | 1.33 | 1.15-1.55 | < 0.01 |
Table: #IQR: Interquartile Range
*AKI: Acute Kidney Injury
*AKI: Acute Kidney Injury
Disclosures:
Yash Shah indicated no relevant financial relationships.
Mina Aknouk indicated no relevant financial relationships.
Pooja Shah indicated no relevant financial relationships.
Pranav Patel indicated no relevant financial relationships.
Pramil Cheriyath indicated no relevant financial relationships.
Milin Shah indicated no relevant financial relationships.
Devina Adalja indicated no relevant financial relationships.
Kirtenkumar Patel indicated no relevant financial relationships.
Dhruvan Patel indicated no relevant financial relationships.
Yash Shah, MD1, Mina Aknouk, MD2, Pooja Shah, MBBS, MS3, Pranav D. Patel, MD4, Pramil Cheriyath, MD, MS2, Milin Shah, MS5, Devina Adalja, MD6, Kirtenkumar Patel, MD7, Dhruvan Patel, MD8. B0023 - African Americans With Pancreatic Adenocarcinoma Have Higher Inpatient Mortality at a Younger Age: A Nationwide Inpatient Sample Study, ACG 2022 Annual Scientific Meeting Abstracts. Charlotte, NC: American College of Gastroenterology.
