Poster Session E - Tuesday Afternoon
Category: Liver
E0501 - HIV Infection in African American Patients With HBV Seen in an Urban Medical Center


Jing Wang, MD
Wayne State University/Detroit Medical Center
Detroit, MI
Presenting Author(s)
1Wayne State University/Detroit Medical Center, Detroit, MI; 2Wayne State University School of Medicine, Detroit, MI; 3Wayne State University School of Medicine, Huntington Woods, MI
Introduction: Hepatitis B virus (HBV) is understudied in the African American (AA) population, a population that has a greater incidence of co-infection with HIV. The objective of this study was to evaluate the differences in pretreatment status and treatment response to HBV anti-viral medications in AA patients with mono-HBV and AA patients with HIV-HBV co-infection.
Methods: Patients with HBV DNA measurement(s) and a minimum of two visits to the university practice clinic before 2021 were identified (n=229). Most of these patients (115) were not on treatment at their earliest visit. The population consisted of 70% AA, 22% Asian/Middle East, and 8% Caucasian individuals. In our study, HIV-HBV patients were on average younger than the mono-HBV patients at first visit (42 vs. 51 years p< 0.0005) and were predominately AA males (98%). In contrast to mono-HBV patients, none of the HIV-HBV patients were Asian. Three groups of AA patients were defined: 1) Mono-HBV not on treatment, 2) Mono-HBV on treatment, and 3) HBV-HIV co-infected on treatment with HBV-specific anti-virals. Statistical analysis was done utilizing t-tests (ANOVA and paired) for continuous variables and mosaic plots with Pearson chi-square analysis for character variables.
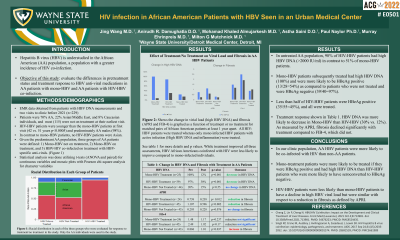
Results: In the untreated AA population, 98% (43/44) of HIV-HBV patients had high HBV DNA ( >2000 IU/ml) in contrast to 51% (33/64) of mono-HBV patients. Mono-HBV patients who were subsequently treated had high HBV DNA (100%) and were more likely to be HBeAg positive (13/28=54%) as compared to patients who were not treated and were HBeAg negative (39/40=97%). Less than half of HIV-HBV patients were HBeAg positive (35/55=45%), and all were treated. The treatment response is shown in Table 1. HBV DNA was more likely to decrease in Mono-HBV patients than HIV-HBV patients (30% vs. 12%). As measured by APRI, fibrosis declined significantly with treatment compared to FIB-4, which did not.
Discussion: In our clinic population, AA HBV patients were more likely to be co-infected with HIV than non-AA patients. Mono-treatment patients were more likely to be treated if they were HBeAg positive and had high HBV DNA than HIV-HBV patients who were more likely to have seroconverted to HBeAg negative. HIV-HBV patients were less likely than mono-HBV patients to have a decline in high HBV viral load but were similar with respect to a reduction in fibrosis as defined by APRI.
Table 1: Change in HBV DNA and Fibrosis with Treatment of AA Patients | ||||
HBV DNA | Pre | Post | p-value | Outcome |
Mono-HBV Treatment | 100% | 12% | p=0.001 | a decrease in HBV DNA |
HIV-HBV Treatment | 97% | 30% | p=0.001 | a decrease in HBV DNA |
Mono-HBV Not Treated | 20% | 15% | p=0.55 | no change in HBV DNA |
APRI |
|
|
| |
Mono-HBV Treatment | 0.738 | 0.238 | p= 0.012 | reduction in fibrosis |
HIV-HBV Treatment | 1.107 | 0.596 | p=0.0023 | reduction in fibrosis |
Mono-HBV Not Treated | 0.295 | 0.228 | p=0.076 | no change in fibrosis |
Fib-4 |
|
|
| |
Mono-HBV Treatment | 1.48 | 1.17 | p=0.237 | reduction not significant |
HIV-HBV Treatment | 2.49 | 1.92 | p=0.17 | reduction not significant |
Mono-HBV Not Treated | 0.868 | 1.01 | p=0.037 | increase in fibrosis |
Disclosures:
Jing Wang, MD1, Anirudh R. Damughatla, DO1, Mohamad Khaled Almujarkesh, MD1, Astha Saini, DO1, Paul Naylor, PhD2, Murray N. Ehrinpreis, MD3, Milton G. Mutchnick, MD2. E0501 - HIV Infection in African American Patients With HBV Seen in an Urban Medical Center, ACG 2022 Annual Scientific Meeting Abstracts. Charlotte, NC: American College of Gastroenterology.
