Poster Session E - Tuesday Afternoon
Category: Stomach
E0684 - Differences in Gastroparesis Hospitalizations Between Rural and Urban Settings


Waseem Amjad, MD
Harvard Medical School
Boston, MA
Presenting Author(s)
1Harvard Medical School, Boston, MA; 2Mountain Vista Medical Center, Mesa, AZ; 3Loyola Medicine/MacNeal Hospital, Berwyn, IL; 4Beth Israel Deaconess Medical Center, Boston, MA
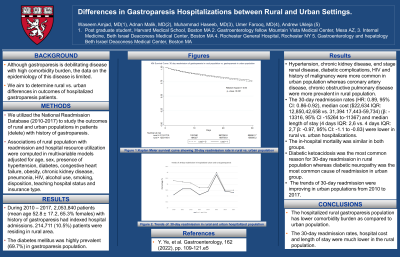
Introduction: Although gastroparesis is debilitating disease with high comorbidity burden, the data on the epidemiology of this disease is limited. We aim to determine rural vs. urban differences in outcomes of hospitalized gastroparesis patients.
Methods: We utilized the National Readmission Database (2010-2017) to study the outcomes of rural and urban populations in patients (delete) with history of gastroparesis. Associations of rural population with readmission and hospital resource utilization were computed in multivariable models adjusted for age, sex, presence of hypertension, diabetes, congestive heart failure, obesity, chronic kidney disease, pneumonia, HIV, alcohol use, smoking, disposition, teaching hospital status and insurance type.
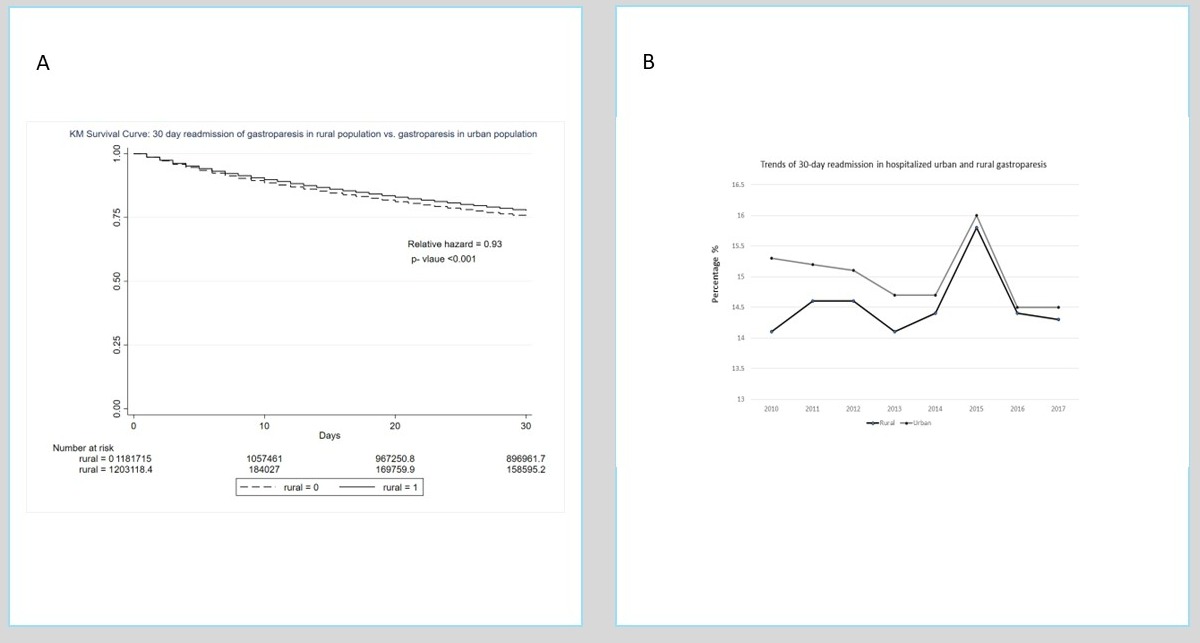
Results: During 2010 – 2017, 2,053,840 patients (mean age 52.8 ± 17.2, 65.3% females) with history of gastroparesis had indexed hospital admissions. 214,711 (10.5%) patients were residing in rural area. The diabetes mellitus was highly prevalent (69.7%) in gastroparesis population. Hypertension, chronic kidney disease, end stage renal disease, diabetic complications, HIV and history of malignancy were more common in urban population whereas coronary artery disease, chronic obstructive pulmonary disease were more prevalent in rural population. The 30-day readmission rates (HR: 0.89, 95% CI: 0.86-0.92), median cost ($22,634 IQR: 12,850,42,658 vs. 31,394 17,443-59,734) (β: -13316, 95% CI -15264 to-11367) and median length of stay (4 days IQR: 2,6 vs. 4 days IQR: 2,7 β: -0.97, 95% CI: -1.1 to -0.83) were lower in rural vs. urban hospitalizations. The in-hospital mortality was similar in both groups. Diabetic ketoacidosis was the most common reason for 30-day readmission in rural population whereas diabetic neuropathy was the most common cause of readmission in urban group. The trends of 30-day readmission were improving in urban populations from 2010 to 2017.
Discussion: : The hospitalized rural gastroparesis population has lower comorbidity burden as compared to urban population. The 30-day readmission rates, hospital cost and length of stay were much lower in the rural population.

B. Trends of 30-day readmission of gastroparesis hospitalized patient from 2010 to 2017
Variables n=number of patients | Total gastroparesis patients (n=2,384,095) | Rural population (n =330,292) | Urban population (n=2,053,840) | P- value | ||
Age | 53.0 ± 16.7 | 53.5 ± 16.5 | 52.9 ± 16.7 | < 0.001 | ||
Female | 1,556,551 (65.3) | 214,711 (65.0) | 1,341,840 (65.3) | 0.27 | ||
Smoker | 511,931 (21.5) | 73,127 (22.1) | 438,805 (21.4) | 0.02 | ||
Alcohol | 47,458 (2.0) | 5,884 (1.8) | 41,575 (2.0) | < 0.001 | ||
Obesity | 405,670 (17.0) | 56,092 (17.0) | 349,578 (17.0) | 0.86 | ||
Hypertension | 1,039,488 (62.4) | 134,978 (60.9) | 904,510 (62.6) | < 0.001 | ||
Type 1 DM | 411,749 (17.3) | 59,162 (17.9) | 352,587 (17.2) | 0.005 | ||
Type 2 DM | 1,248,767 (52.4) | 175,134 (53) | 1,073,634 (52.3) | 0.03 | ||
Diabetic retinopathy | 198,473 (8.3) | 22,905 (6.9) | 175,568 (8.6) | < 0.001 | ||
Diabetic neuropathy | 627,526 (26.3) | 88,362 (26.8) | 539,164 (26.3) | 0.18 | ||
Diabetic nephropathy | 259,042 (10.9) | 32,852 (10.0) | 226,190 (11.0) | < 0.001 | ||
COPD | 174,409 (7.3) | 30,971 (9.4) | 143,438 (7.0) | < 0.001 | ||
Coronary artery disease | 565,482 (23.7) | 82,628 (25.0) | 482,854 (23.5) | < 0.001 | ||
Congestive heart failure | 728,433 (30.6) | 100,306 (30.4) | 628,127 (30.6) | 0.5 | ||
Chronic kidney disease | 552,153 (23.2) | 71,564 (21.7) | 480,589 (23.4) | < 0.001 | ||
ESRD | 334,265 (14.0) | 35,575 (10.8) | 298,690 (14.5) | < 0.001 | ||
Malnutrition | 217,134 (9.1) | 30,010 (9.1) | 187,124 (9.1) | 0.89 | ||
Pneumonia | 163,785 (6.9) | 26,115 (7.9) | 137,670 (6.7) | < 0.001 | ||
HIV | 15,842 (0.7) | 1,086 (0.3) | 14,757 (0.7) | < 0.001 | ||
History of malignancy | 126,355 (5.3) | 15,813 (4.8) | 110,542 (5.4) | < 0.001 | ||
Peptic ulcer disease | 200,478 (8.4) | 26,184 (7.9) | 174,294 (8.5) | 0.005 | ||
Nonvariceal upper GI bleeding | 87,294 (3.7) | 10.969 (3.3) | 76,325 (3.7) | < 0.001 | ||
Lower GI bleeding | 86,666 (3.6) | 11,792 (3.6) | 74,873 (3.7) | 0.34 | ||
Septic shock | 36,783 (1.5) | 4,540 (1.4) | 32,244 (1.6) | < 0.001 | ||
ICU admission | 89,768 (3.8) | 10,958 (3.3) | 78,810 (3.8) | < 0.001 | ||
Teaching hospital | 1,366,346 (57.3) | 79,730 (24.1) | 1,286,616 (62.6) | < 0.001 | ||
Insurance | Medicare | 1,270,059 (53.4) | 187,504 (57) | 1,082,555 (52.8) | < 0.001 | |
Medicaid | 473,251 (19.9) | 61,691 (18.7) | 411,561 (20.1) | |||
Private | 468,711 (19.7) | 55,655 (16.9) | 413,056 (20.1) | |||
Self-pay | 94,936 (4.0) | 14,816 (4.5) | 80,120 (3.9) | |||
High Charlson comorbidity score | 1,758,091 (73.7) | 240,094 (72.7) | 1,517,998 (73.9) | < 0.001 | ||
Disposition | Home | 1,563,076 (65.6) | 222,497 (67.4) | 1,340,579 (65.3) | < 0.001 | |
Short term inpatient | 18,135 (0.8) | 4,402 (1.3) | 13,732 (0.7) | |||
Transfer to SNF, ICF | 317,217 (13.3) | 43,663 (13.2) | 273,554 (13.3) | |||
Home care | 389,479 (16.3) | 47,970 (14.5) | 341,508 (16.6) | |||
Disclosures:
Waseem Amjad, MD1, Adnan Malik, MD2, Muhammad Haseeb, MD1, Umer Farooq, MD3, Andrew Ukleja, MD4. E0684 - Differences in Gastroparesis Hospitalizations Between Rural and Urban Settings, ACG 2022 Annual Scientific Meeting Abstracts. Charlotte, NC: American College of Gastroenterology.
