Poster Session A - Sunday Afternoon
A0202 - Dramatic Stabilization of Trend of Esophageal Adenocarcinoma (EAC) in the United States: A Population-Based Time-Trend Analysis of Surveillance, Epidemiology and End Results Program Database (SEER), 2001-2018

Navkiran Randhawa, DO
Franciscan Health
Olympia Fields, IL
Presenting Author(s)
Navkiran Randhawa, DO1, Janice Eunsoo Oh, MD2, Yazan Abboud, MD2, Kevin Waters, MD, PhD2, Mohamad Othman El Helou, MD2, Jun Gong, MD2, Harmik Soukiasian, MD2, Kenneth Park, MD2, Quin Liu, MD2, Rabindra Watson, MD2, Simon Lo, MD2, Srinivas Gaddam, MD2
1Franciscan Health, Olympia Fields, IL; 2Cedars-Sinai Medical Center, Los Angeles, CA
Introduction: Prior studies showed that EAC had dramatically increased by 611% from 1973 to 2001. Therefore, the aim of this study was to determine the recent incidence trends of EAC by histopathology in the United States from 2000-2018 using the SEER database.
Methods: Incidence rates of esophageal cancer per 100,000 population (age-adjusted to the 2000 US population) from 2000 to 2018 were calculated from the SEER 21 database using SEER*Stat software (v8.4.1, National Cancer Institute (NCI). Esophageal cancer was defined as any cancer located within the esophagus, and the histopathology subtypes were grouped as EAC or squamous cell cancer (SCC) based on ICD-O-3 Codes (Table 1). Time-trends reported as annual percentage change (APC) and average APC (AAPC) were quantified by Joinpoint Regression Program (v4.9.0.1, NCI), utilizing Monte Carlo permutation analysis to identify the best fit. A 2-tailed t-test was utilized to access statistical significance (p-value < 0.05). Pairwise comparison between the segmented-linear trends was performed to test parallelism and identicalness of the trends.
Results: A total of 103,117 (79% male) patients were diagnosed with esophageal cancer from 2000-2018. Of those, 58,782 were diagnosed with EAC while 34,084 were diagnosed with SCC (Table 1).
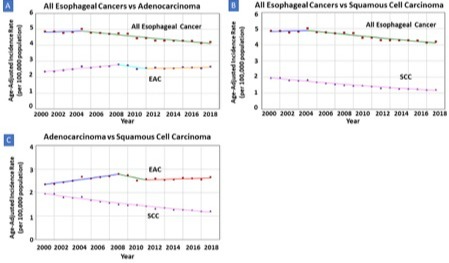
The overall incidence rate of esophageal cancer was found to be stable from 2000-2004 [APC 0.37% (95% CI, -1.32-2.07%)] but significantly decreased from 2004-2018 [APC -1.24% (95% CI, -1.48% - -1.01%)]. In SCC, the trend has shown a consistent decrease in incidence rate from 2000-2018 [APC -2.81% (95% CI, -3.03% - -2.59%)]. EAC trends showed two joinpoints. with a peak incidence noted in 2007 (Table and Figure). Despite slight variation in trends across joinpoints , the overall trend of EAC incidence was not statistically significant and therefore stable over this time period [0.61% (95% CI, -0.30% - 1.53%)], p-value = 0.19. The trends between the histopathology groups of EAC and SCC, were not identical nor parallel (p-value < 0.001), showing that the trends between these two groups differed from one another.
Discussion: While previous studies showed a >600% increase in incidence of EAC from 1973 to 2001, our updated large population-based study, covering more than a third of the US population, shows a dramatically improved stable trend from 2000 to 2018. Future studies should evaluate the impact of proton pump inhibitor use and endoscopic therapies on these trends.

A: The incidence of esophageal cancers significantly decreased [AAPC -0.89% (95% CI, -1.26%- -0.51%)] while the incidence of EAC had 3 varying segments of incidence rate: 2000 to 2008 had an increase [APC 2.13% (95% CI, 1.46% - 2.80%)], 2008-2011 had a decrease [APC -3.05% (95% CI, -8.34% - 2.54%)] and 2011 to 2018 had a stable trend [APC 0.49% (95% CI, -0.23% - 1.21%)].
B: The incidence of SCC consistently decreased [APC -2.81% (95% CI, -3.03% - -2.59%)]
C: The incidence of EAC and SCC were not identical nor parallel (both p-value < 0.001).
Table 1. Incidence Trends of Esophageal Cancer in the United States by Histopathology (2000-2018) | |||||||
| Cases | Trends | Pairwise Comparison | ||||
Years | APC | AAPCa | AAPC | Test of Coincidence | Test of Parallelism | ||
All Esophageal Cancer | 103,117 | 2000 ⎼ 2004 | 0.37% | -0.89% | < 0.001 | ⎼ | ⎼ |
2004 ⎼ 2018 | -1.24% | ||||||
Histopathology | |||||||
Esophageal | 58,782 | 2000 ⎼ 2008 | 2.13% | 0.61% | 0.19 | < 0.001 | < 0.001 |
2008 ⎼ 2011 | -3.05% | ||||||
2011 ⎼ 2018 | 0.49% | ||||||
Squamous Cell | 34,084 | 2000 ⎼ 2008 | -2.81% | -2.81% | < 0.001 | ||
a AAPC is calculated as average of APCs over the time period of 2000-2008. | |||||||
Disclosures:
Navkiran Randhawa, DO1, Janice Eunsoo Oh, MD2, Yazan Abboud, MD2, Kevin Waters, MD, PhD2, Mohamad Othman El Helou, MD2, Jun Gong, MD2, Harmik Soukiasian, MD2, Kenneth Park, MD2, Quin Liu, MD2, Rabindra Watson, MD2, Simon Lo, MD2, Srinivas Gaddam, MD2. A0202 - Dramatic Stabilization of Trend of Esophageal Adenocarcinoma (EAC) in the United States: A Population-Based Time-Trend Analysis of Surveillance, Epidemiology and End Results Program Database (SEER), 2001-2018, ACG 2022 Annual Scientific Meeting Abstracts. Charlotte, NC: American College of Gastroenterology.


