Back

Poster Session B - Monday Morning
Category: Colorectal Cancer Prevention
B0165 - Global Increase of Colorectal Cancer in Young Adults Over the Last 29 Years: An Analysis of the Global Burden of Disease Study 1990-2019
Monday, October 24, 2022
10:00 AM – 12:00 PM ET
Location: Crown Ballroom

- YW
Yichen Wang, MD
Trinity Health of New England
Springfield, MA
Presenting Author(s)
Yichen Wang, MD1, Xiaoquan Huang, MD2, Mahesh Cheryala, MD3, Bing Chen, MD4, Mark M. Aloysius, MD, PhD5
1Trinity Health of New England, Springfield, MA; 2Zhongshan Hospital of Fudan University, Shanghai, Shanghai, China; 3The Wright Center for Graduate Medical Education, Scranton, PA; 4New York University School of Medicine, New York, NY; 5The Wright Center for Graduate Medical Education, Geisinger Commonwealth School of Medicine, ATSU-SOMA, Scranton, PA
Introduction: The United States Preventive Services Taskforce lowered the recommended starting age for colorectal cancer (CRC) screening in average-risk adults from 50 to 45 years due to a rapid increase in young CRC incidence and overall favorable benefit-to-burden ratio in the US. This recommendation has not been widely adopted by other countries partially because the burden of young CRC in these countries is unclear compared to the United States.
Methods: The incidence rates of early-onset CRC in young adults (defined as the onset of CRC in individuals aged between 20 to 49 years) from 1990 to 2019 were collected from the Global Health Data Exchange (GHDx) results tool (available at https://vizhub.healthdata.org/gbd-results). Data from 204 countries and geographic areas were available. The socio-demographic index (SDI) was used to categorize countries and geographic areas by development (low, low-middle, middle, high-middle, and high).
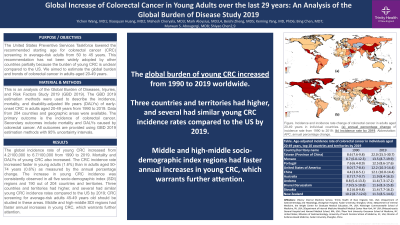
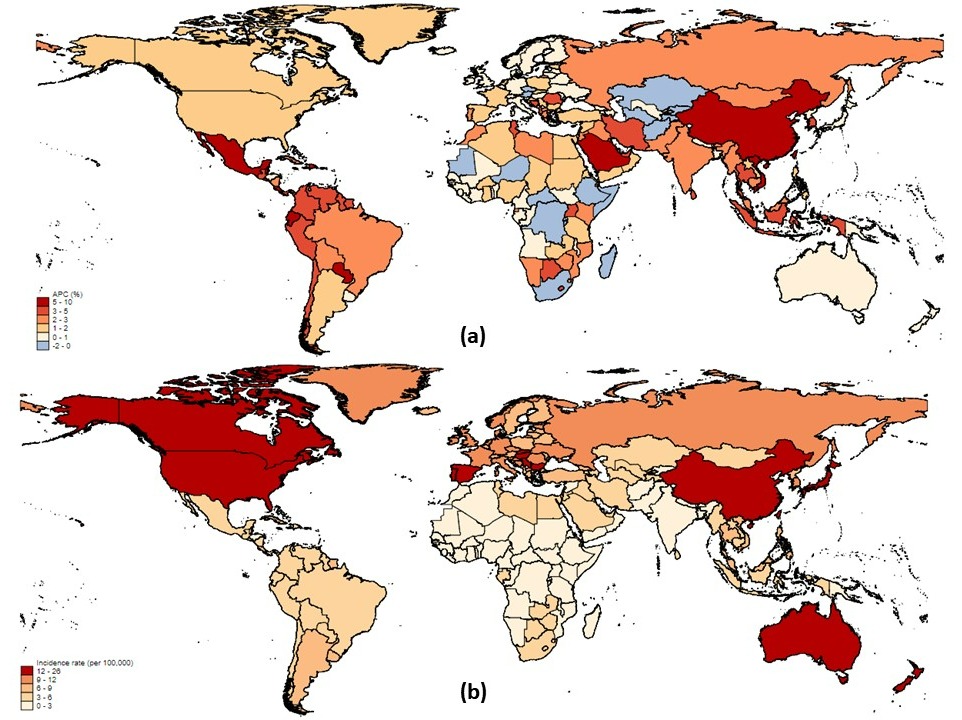
Results: The global incidence rate of young CRC increased from 4.2/100,000 to 6.7/100,000 from 1990 to 2019, with an annual percentage change (APC) of 1.6%. The increase in CRC incidence rate was faster in young adults than in individuals aged 50-74 years (APC 0.6%). In the high HDI region, the CRC incidence rate decreased in adults aged 50-74 years old while it increased in adults 20-49 years old from 1995 to 2019 (Table). The increase in young CRC incidence rate was consistently observed in all five SDI regions and 185 out of 204 countries and territories (Figure a). Middle (120.8%), high-middle (98.5%), and low-middle (63.7%) SDI regions experienced the most rapid increase in young CRC incidence rate, while the high SDI region had the highest incidence rate by 2019 (11.5 per 100,000). By 2019, nine countries and territories (Taiwan, Monaco, Portugal, Andorra, Japan, China, Bulgaria, Hungary, and Slovakia) had higher young CRC incidence rates than the United States (Figure b); CRC screening for average-risk adults aged 45-49 years should be studied in these countries. A concerning 142 countries had a higher annual percentage increase of young CRC than the United States, which warrants further attention and investigation.
Discussion: The global incidence, mortality, and DALYs of young CRC increased from 1990 to 2019. The increase in young CRC incidence was prevalent in most countries worldwide. Several countries were found to have higher incidence rates or faster increase in young CRC, which warrants further attention.

Disclosures:
Yichen Wang, MD1, Xiaoquan Huang, MD2, Mahesh Cheryala, MD3, Bing Chen, MD4, Mark M. Aloysius, MD, PhD5. B0165 - Global Increase of Colorectal Cancer in Young Adults Over the Last 29 Years: An Analysis of the Global Burden of Disease Study 1990-2019, ACG 2022 Annual Scientific Meeting Abstracts. Charlotte, NC: American College of Gastroenterology.
1Trinity Health of New England, Springfield, MA; 2Zhongshan Hospital of Fudan University, Shanghai, Shanghai, China; 3The Wright Center for Graduate Medical Education, Scranton, PA; 4New York University School of Medicine, New York, NY; 5The Wright Center for Graduate Medical Education, Geisinger Commonwealth School of Medicine, ATSU-SOMA, Scranton, PA
Introduction: The United States Preventive Services Taskforce lowered the recommended starting age for colorectal cancer (CRC) screening in average-risk adults from 50 to 45 years due to a rapid increase in young CRC incidence and overall favorable benefit-to-burden ratio in the US. This recommendation has not been widely adopted by other countries partially because the burden of young CRC in these countries is unclear compared to the United States.
Methods: The incidence rates of early-onset CRC in young adults (defined as the onset of CRC in individuals aged between 20 to 49 years) from 1990 to 2019 were collected from the Global Health Data Exchange (GHDx) results tool (available at https://vizhub.healthdata.org/gbd-results). Data from 204 countries and geographic areas were available. The socio-demographic index (SDI) was used to categorize countries and geographic areas by development (low, low-middle, middle, high-middle, and high).
Results: The global incidence rate of young CRC increased from 4.2/100,000 to 6.7/100,000 from 1990 to 2019, with an annual percentage change (APC) of 1.6%. The increase in CRC incidence rate was faster in young adults than in individuals aged 50-74 years (APC 0.6%). In the high HDI region, the CRC incidence rate decreased in adults aged 50-74 years old while it increased in adults 20-49 years old from 1995 to 2019 (Table). The increase in young CRC incidence rate was consistently observed in all five SDI regions and 185 out of 204 countries and territories (Figure a). Middle (120.8%), high-middle (98.5%), and low-middle (63.7%) SDI regions experienced the most rapid increase in young CRC incidence rate, while the high SDI region had the highest incidence rate by 2019 (11.5 per 100,000). By 2019, nine countries and territories (Taiwan, Monaco, Portugal, Andorra, Japan, China, Bulgaria, Hungary, and Slovakia) had higher young CRC incidence rates than the United States (Figure b); CRC screening for average-risk adults aged 45-49 years should be studied in these countries. A concerning 142 countries had a higher annual percentage increase of young CRC than the United States, which warrants further attention and investigation.
Discussion: The global incidence, mortality, and DALYs of young CRC increased from 1990 to 2019. The increase in young CRC incidence was prevalent in most countries worldwide. Several countries were found to have higher incidence rates or faster increase in young CRC, which warrants further attention.

Figure: Figure. Incidence and incidence rate change of colorectal cancer in adults aged 20-49 years in individual countries. (a) annual percentage change of incidence rate from 1990 to 2019; (b) incidence rate by 2019. Abbreviation: APC, annual percentage change.
| Table. The incidence rate of colorectal cancer (per 100,000) by age groups in high SDI countries. | ||||
| Year | 25-49 years | 40-44 years | 45-49 years | 50-74 years |
| 1990 | 10.32 (10.50-10.14) | 14.95 (15.35-14.52) | 29.23 (29.90-28.60) | 138.74 (140.71-136.16) |
| 1991 | 10.54 (10.72-10.39) | 15.35 (15.74-14.94) | 29.83 (30.54-29.15) | 141.39 (143.40-138.81) |
| 1992 | 10.79 (10.98-10.63) | 15.66 (16.04-15.27) | 29.99 (30.72-29.30) | 144.48 (146.51-141.82) |
| 1993 | 11.19 (11.35-11.03) | 16.09 (16.48-15.68) | 30.56 (31.28-29.88) | 149.43 (151.53-146.66) |
| 1994 | 11.34 (11.51-11.18) | 16.11 (16.48-15.71) | 30.56 (31.28-29.85) | 150.59 (152.74-147.77) |
| 1995 | 11.64 (11.81-11.47) | 16.22 (16.62-15.83) | 30.99 (31.70-30.29) | 152.43 (154.73-149.46) |
| 1996 | 11.77 (11.95-11.61) | 16.06 (16.44-15.67) | 31.05 (31.79-30.35) | 151.11 (153.26-148.11) |
| 1997 | 11.89 (12.07-11.72) | 16.16 (16.54-15.78) | 31.20 (31.93-30.48) | 148.85 (151.05-145.92) |
| 1998 | 12.03 (12.21-11.86) | 16.27 (16.64-15.88) | 31.52 (32.26-30.86) | 148.92 (151.13-145.92) |
| 1999 | 12.20 (12.40-12.03) | 16.39 (16.77-16.00) | 31.82 (32.58-31.15) | 149.03 (151.22-145.86) |
| 2000 | 12.42 (12.61-12.25) | 16.59 (17.00-16.20) | 31.98 (32.74-31.31) | 147.03 (149.39-143.93) |
| 2001 | 12.69 (12.88-12.51) | 16.78 (17.18-16.37) | 32.29 (33.11-31.62) | 145.39 (147.74-142.14) |
| 2002 | 12.91 (13.10-12.72) | 17.01 (17.41-16.60) | 32.43 (33.27-31.78) | 144.69 (147.04-141.35) |
| 2003 | 13.17 (13.38-12.97) | 17.23 (17.64-16.80) | 32.66 (33.47-31.95) | 144.57 (146.96-141.31) |
| 2004 | 13.17 (13.36-12.98) | 17.16 (17.56-16.76) | 32.29 (33.05-31.58) | 141.29 (143.78-138.17) |
| 2005 | 13.32 (13.52-13.13) | 17.33 (17.74-16.92) | 32.39 (33.16-31.68) | 140.09 (142.60-136.83) |
| 2006 | 13.33 (13.52-13.13) | 17.34 (17.77-16.92) | 32.24 (33.00-31.51) | 137.39 (139.96-134.19) |
| 2007 | 13.42 (13.66-13.22) | 17.44 (17.89-17.02) | 32.40 (33.21-31.67) | 137.23 (139.75-133.85) |
| 2008 | 13.71 (13.95-13.50) | 17.87 (18.35-17.43) | 32.93 (33.79-32.18) | 138.09 (140.73-134.53) |
| 2009 | 13.92 (14.17-13.71) | 18.21 (18.68-17.77) | 33.36 (34.20-32.59) | 138.41 (141.12-134.78) |
| 2010 | 13.82 (14.06-13.60) | 18.05 (18.54-17.59) | 33.07 (33.91-32.27) | 137.62 (140.35-134.00) |
| 2011 | 13.75 (13.97-13.52) | 18.05 (18.56-17.60) | 32.94 (33.75-32.11) | 137.41 (139.91-133.68) |
| 2012 | 13.54 (13.77-13.29) | 17.89 (18.43-17.42) | 32.47 (33.31-31.62) | 136.13 (138.88-132.39) |
| 2013 | 13.46 (13.71-13.19) | 17.92 (18.52-17.41) | 32.28 (33.14-31.37) | 135.93 (138.74-132.04) |
| 2014 | 13.39 (13.65-13.12) | 18.02 (18.64-17.49) | 31.95 (32.89-31.02) | 135.07 (137.93-131.12) |
| 2015 | 13.41 (13.71-13.12) | 18.15 (18.82-17.57) | 31.85 (32.85-30.90) | 135.57 (138.61-131.56) |
| 2016 | 13.54 (13.86-13.22) | 18.35 (19.03-17.72) | 31.90 (32.94-30.94) | 136.35 (139.34-132.16) |
| 2017 | 13.44 (14.08-12.84) | 18.35 (19.36-17.42) | 31.51 (33.21-29.83) | 136.33 (143.01-129.90) |
| 2018 | 13.39 (14.38-12.41) | 18.34 (19.81-16.93) | 31.61 (34.28-29.15) | 137.80 (148.99-127.26) |
| 2019 | 13.30 (14.50-12.22) | 18.09 (19.84-16.48) | 31.60 (34.91-28.60) | 138.95 (151.53-127.17) |
| Abbreviation: SDI, Socio-Demographic Index. Numbers present under age groups: incidence rate (95% uncertainty interval). Uncertainty intervals are a range of values that are likely to include the correct estimate of health loss for a given cause. Limited data create substantial uncertainty. | ||||
Table: Table. The incidence rate of colorectal cancer (per 100,000) by age groups in high SDI countries.
Disclosures:
Yichen Wang indicated no relevant financial relationships.
Xiaoquan Huang indicated no relevant financial relationships.
Mahesh Cheryala indicated no relevant financial relationships.
Bing Chen indicated no relevant financial relationships.
Mark Aloysius indicated no relevant financial relationships.
Yichen Wang, MD1, Xiaoquan Huang, MD2, Mahesh Cheryala, MD3, Bing Chen, MD4, Mark M. Aloysius, MD, PhD5. B0165 - Global Increase of Colorectal Cancer in Young Adults Over the Last 29 Years: An Analysis of the Global Burden of Disease Study 1990-2019, ACG 2022 Annual Scientific Meeting Abstracts. Charlotte, NC: American College of Gastroenterology.
