Poster Session B - Monday Morning
Category: IBD
B0351 - The Effect of Mirikizumab on Fecal Calprotectin and C-Reactive Protein in Phase 3 Studies of Patients With Moderately-to-Severely Active Ulcerative Colitis


Bruce E. Sands, MD, MS, FACG
Icahn School of Medicine at Mount Sinai
New York, NY
Presenting Author(s)
1Medizinische Klinik für Gastroenterologie, Infektiologie und Rheumatologie, Charité - Universitätsmedizin Berlin, Berlin, Berlin, Germany; 2Icahn School of Medicine at Mount Sinai, New York, NY; 3Eli Lilly and Company, Indianapolis, IN; 4Eli Lilly Portugal, Produtos Farmacêuticos, Lda, Lisbon, Lisboa, Portugal; 5Amsterdam UMC, Amsterdam, Noord-Holland, Netherlands
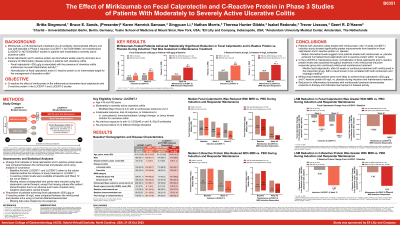
Introduction: This study explores the effect of mirikizumab (miri) on inflammatory biomarkers fecal calprotectin (FC) and C-reactive protein (CRP) in patients with moderately-to-severely active ulcerative colitis (UC).
Methods: In LUCENT-1 (NCT03518086), 1162 patients were randomized 3:1 to receive intravenous miri 300 mg or placebo (PBO) every 4 weeks for 12 weeks. Patients (N=544) who achieved clinical response with miri at Week (W) 12 were re-randomized 2:1 in LUCENT-2 (NCT03524092) to receive blinded miri 200 mg or PBO subcutaneously every 4 weeks through W40 (52 weeks continuous therapy). Treatment comparison of change from baseline in FC and CRP levels were made using ANCOVA analysis. Comparison of proportion of patients achieving FC ≤250 μg/g used a Cochran–Mantel Haenszel test treating missing data as nonresponse.
Results: At baseline, the median FC was 1556.0 µg/g in the miri group and 1465.0 µg/g in the PBO group (Table); the proportion of patients with FC >250 µg/g were similar between treatment groups (miri: 90.4%; PBO: 88.9%). At both W4 and W12 of LUCENT-1, miri-treated patients showed greater reduction in FC from baseline compared to PBO (p< .001). Among patients with baseline FC level >250 µg/g, a greater proportion of miri-treated patients achieved an FC level of ≤250 µg/g compared to PBO (34.3% vs 20.1%; adjusted risk difference: 14.6%; 95% confidence interval [CI]: 8.3%–20.9%; p< .001) at W12. For those who continued with maintenance therapy in LUCENT-2, at W40, miri-treated patients sustained greater FC reduction from baseline compared to PBO (p< .001). A greater proportion of miri-treated patients with induction baseline FC >250 µg/g achieved FC level of ≤250 µg/g compared to PBO (50.7% vs 19.3%; adjusted risk difference: 29.1%; 95% CI: 20.5%–37.7%; p< .001) at W40. At baseline, the median CRP was 4.0 mg/L in the miri group and 4.3 mg/L in the PBO group (Table). At W12, patients in the miri group showed greater reduction in CRP from baseline compared to PBO (p< .001). Among those who continued in LUCENT-2, at W40, miri-treated patients sustained greater reduction in CRP from baseline compared to PBO (p< .001).
Discussion: Patients treated with miri in both induction and maintenance studies were more likely to achieve an FC ≤ 250 µg/g and showed significantly greater reductions from baseline in FC and CRP when compared to PBO.
Biomarker | Study | Time Point | Treatment | n | Median (IQR) | LS Mean (SE)b | LS Mean Differenceb (95% CIb) | Between |
Fecal Calprotectin
| LUCENT-1 | Baseline | Placebo | 243 | 1465.0 | 2970.1 (303.5) | - | - |
Miri 300 mg IV | 722 | 1556.0 | 3121.4 (176.1) | |||||
Week 12 | Placebo | 243 | 1040.0 | 2386.0 (206.9) | -1164.1 (-1613.1, -715.0) | < .001 | ||
Miri 300 mg IV | 722 | 398.0 | 1221.9 (129.9) | |||||
LUCENT-2 (miri induction responder) | Week 40a | Placebo | 156 | 496.0 | 1862.6 (221.4) | -839.6 (-1323.1, -356.2) | < .001 | |
Miri 200 mg SC | 302 | 155.0 | 1022.9 (172.4) | |||||
C-Reactive Protein
| LUCENT-1 | Baseline | Placebo | 279 | 4.3 | 9.4 (0.9) | - | - |
Miri 300 mg IV | 837 | 4.0 (1.5-9.5) | 9.3 (0.5) | |||||
Week 12 | Placebo | 279 | 3.1 | 8.4 (0.6) | -3.7 (-5.0, -2.5) | < .001 | ||
Miri 300 mg IV | 837 | 1.7 | 4.7 (0.4) | |||||
LUCENT-2 (miri induction responder) | Week 40a | Placebo | 178 | 1.6 (0.7-5.1) | 7.0 (0.7) | -3.3 (-4.9, -1.7) | < .001 | |
Miri 200 mg SC | 359 | 1.4 | 3.6 (0.5) | |||||
ANCOVA=analysis of covariance; CI=confidence interval; IQR=interquartile range; IV=intravenous; LS=least square; miri=mirikizumab; n=number of patients with baseline and post-baseline value at specified timepoint; SC=subcutaneous; SE=standard error a 52 weeks of continuous therapy; b ANCOVA model for endpoint measures; patients with missing value at the designated timepoint had their last value carried forward, with the exception that patients who discontinued due to an adverse event had their baseline value carried forward. | ||||||||
Disclosures:
Britta Siegmund, MD1, Bruce E. Sands, MD, MS, FACG2, Karen Samaan, PharmD3, Xingyuan Li, PhD3, Nathan Morris, PhD3, Theresa Hunter Gibble, PhD3, Isabel Redondo, MD4, Trevor Lissoos, MD3, Geert D’Haens, MD, PhD5. B0351 - The Effect of Mirikizumab on Fecal Calprotectin and C-Reactive Protein in Phase 3 Studies of Patients With Moderately-to-Severely Active Ulcerative Colitis, ACG 2022 Annual Scientific Meeting Abstracts. Charlotte, NC: American College of Gastroenterology.

