Back


Poster Session B - Monday Morning
Category: IBD
B0404 - Association Between Nutritional Profile and Disease Activity in a Sample of Lebanese Patients With Inflammatory Bowel Disease (IBD): A Case Control Study
Monday, October 24, 2022
10:00 AM – 12:00 PM ET
Location: Crown Ballroom

Has Audio

Lea N. Sayegh, MD
American University of Beirut
Beirut, Beyrouth, Lebanon
Presenting Author(s)
Lea N. Sayegh, MD1, Fadi H. Mourad, MD1, Nicole Fakhoury-Sayegh, PhD2, Charbel Chidiac, MD1, Rashad Nawfal, 1, Fady Daniel, MD1, Kassem Barada, MD1, Ala I. Sharara, MD1, Fadi F. Francis, MD1, Jana G. Hashash, MD, MSc3
1American University of Beirut, Beirut, Beyrouth, Lebanon; 2Saint Joseph University, Beirut, Beyrouth, Lebanon; 3Mayo Clinic Florida, Jacksonville, FL
Introduction: Many studies have evaluated dietary habits of patients with inflammatory bowel disease (IBD) and their impact on disease activity. This study aims to evaluate this association in Lebanese patients with IBD, as no investigation of this kind has been done in Lebanon.
Methods: In this prospective study, patients with IBD were identified by their treating physicians while controls were recruited via emails sent to staff and students at the affiliated university. Both groups were gender and age matched. Baseline characteristics and nutritional profile, as assessed using a validated food frequency questionnaire (FFQ) adapted to the Lebanese diet were compared between cases and controls. Cases were divided into 2 groups, those in remission and those with active disease according to the Harvey-Bradshaw Index for Crohn’s disease (HBCD) and Ulcerative Colitis Activity Index (UCAI).
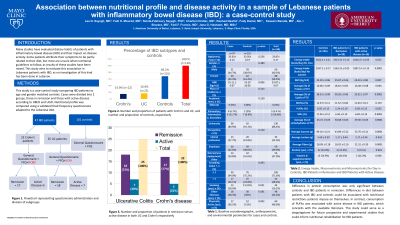
Results: A total of 47 patients with IBD and 101 controls were included. There was no difference in mean age between cases and controls. Patients with IBD consumed significantly less % of lipids, saturated fatty acids (SFAs), fiber, and sucrose compared to controls (p=0.0001). The multivariate analysis comparing cases to controls showed higher odds of consuming more % carbohydrates of total energy intake (TEI) at 1.31 (95%CI; 1.15-1.51) and more % proteins of TEI at 1.25 (95%CI;1.09-1.43), and lower odds of consuming fiber at 0.934 (95%CI;0.89-0.99). There was no difference in odds of fat consumption between cases and controls. Of 47 IBD patients, 25 UC and 22 CD, 28 were in clinical remission (HBCD ≤ 4 or UCAI ≤ 2) and 19 had active disease. IBD patients in remission consumed more % protein than controls (p=0.032). The % intake of poly-unsaturated fatty acids (PUFAs) was higher among IBD patients with active disease than those in remission, specifically among those with UC (p=0.032).
Discussion: Although there was a difference in protein consumption between cases and controls, it was only significant between controls and IBD patients in remission. It is possible that differences in diet between patients with IBD and controls were associated with nutritional restrictions patients impose on themselves. In contrast, consumption of PUFAs was associated with active disease in IBD patients, which concords with the available literature. This study could serve as a steppingstone for future prospective and experimental studies that could inform nutritional rehabilitation for IBD patients.
Disclosures:
Lea N. Sayegh, MD1, Fadi H. Mourad, MD1, Nicole Fakhoury-Sayegh, PhD2, Charbel Chidiac, MD1, Rashad Nawfal, 1, Fady Daniel, MD1, Kassem Barada, MD1, Ala I. Sharara, MD1, Fadi F. Francis, MD1, Jana G. Hashash, MD, MSc3. B0404 - Association Between Nutritional Profile and Disease Activity in a Sample of Lebanese Patients With Inflammatory Bowel Disease (IBD): A Case Control Study, ACG 2022 Annual Scientific Meeting Abstracts. Charlotte, NC: American College of Gastroenterology.
1American University of Beirut, Beirut, Beyrouth, Lebanon; 2Saint Joseph University, Beirut, Beyrouth, Lebanon; 3Mayo Clinic Florida, Jacksonville, FL
Introduction: Many studies have evaluated dietary habits of patients with inflammatory bowel disease (IBD) and their impact on disease activity. This study aims to evaluate this association in Lebanese patients with IBD, as no investigation of this kind has been done in Lebanon.
Methods: In this prospective study, patients with IBD were identified by their treating physicians while controls were recruited via emails sent to staff and students at the affiliated university. Both groups were gender and age matched. Baseline characteristics and nutritional profile, as assessed using a validated food frequency questionnaire (FFQ) adapted to the Lebanese diet were compared between cases and controls. Cases were divided into 2 groups, those in remission and those with active disease according to the Harvey-Bradshaw Index for Crohn’s disease (HBCD) and Ulcerative Colitis Activity Index (UCAI).
Results: A total of 47 patients with IBD and 101 controls were included. There was no difference in mean age between cases and controls. Patients with IBD consumed significantly less % of lipids, saturated fatty acids (SFAs), fiber, and sucrose compared to controls (p=0.0001). The multivariate analysis comparing cases to controls showed higher odds of consuming more % carbohydrates of total energy intake (TEI) at 1.31 (95%CI; 1.15-1.51) and more % proteins of TEI at 1.25 (95%CI;1.09-1.43), and lower odds of consuming fiber at 0.934 (95%CI;0.89-0.99). There was no difference in odds of fat consumption between cases and controls. Of 47 IBD patients, 25 UC and 22 CD, 28 were in clinical remission (HBCD ≤ 4 or UCAI ≤ 2) and 19 had active disease. IBD patients in remission consumed more % protein than controls (p=0.032). The % intake of poly-unsaturated fatty acids (PUFAs) was higher among IBD patients with active disease than those in remission, specifically among those with UC (p=0.032).
Discussion: Although there was a difference in protein consumption between cases and controls, it was only significant between controls and IBD patients in remission. It is possible that differences in diet between patients with IBD and controls were associated with nutritional restrictions patients impose on themselves. In contrast, consumption of PUFAs was associated with active disease in IBD patients, which concords with the available literature. This study could serve as a steppingstone for future prospective and experimental studies that could inform nutritional rehabilitation for IBD patients.
| Controls (n=101) | IBD patients in Remission (n=28) | IBD patients with active disease (n=19) | p-value | DRI | |
| Energy Intake (kcals/day) for men | 2622.4 ± 0.21 | 1923.53 ± 0.16 | 1644.37 ± 0.03 | 0.015 | 2300-2900 |
| Energy Intake (kcals/day) for women | 2597.2 ± 0.17 | 1563.15 ± 0.05 | 1897.14 ± 0.13 | 0.0001 | 1900-2200 |
| BMI (kg/m2) | 23.29 ± 0.06 | 25.87 ± 0.06 | 24.03 ± 0.08 | 0.007 | N/A |
| Average (%) of Protein of TEI | 16.06 ± 0.09 | 18.62 ± 0.05 | 16.48 ± 0.08 | 0.004 | 10-35 |
| Average (%) of Lipids of TEI | 38.33 ± 0.08 | 30.28 ± 0.06 | 33.02 ± 0.07 | 0.0001 | 20-35 |
| MUFAs (%) | 12.33 ± 0.11 | 11.52 ± 0.06 | 11.04 ± 0.12 | 0.119 | 15-20 |
| PUFAs (%) | 6.05 ± 0.15 | 5.14 ± 0.10 | 6.58 ± 0.12 | 0.032 | 5-10 |
| SFAs (%) | 11.95 ± 0.12 | 6.50 ± 0.14 | 6.84 ± 0.14 | 0.0001 | < 10 |
| Average (%) of carbohydrates of TEI | 45.15 ± 0.05 | 50.68 ± 0.03 | 49.30 ± 0.05 | 0.0001 | 45-65 |
| Average Sucrose (g) | 89.16 ± 0.21 | 43.89 ± 0.22 | 52.70 ± 0.21 | 0.0001 | 50 |
| Average Lactose (g) | 5.60 ± 0.59 | 5.17 ± 0.44 | 5.17 ± 0.44 | 0.942 | N/A |
| Average Fibers (g) | 28.09 ± 0.18 | 18.02 ± 0.10 | 21.52 ± 0.20 | 0.0001 | 20-38 |
| Alcohol (yes), n (%) | 22 (23.9%) | 4 (14.3%) | 6 (31.6) | 0.918 | N/A |
| Vitamin D supplementation (yes), n (%) | 15 (14.9%) | 13 (46.4%) | 5 (26.3%) | 0.006 | N/A |
Table: Energy Intake, Macronutrients and Micronutrients Per Day in Controls, IBD Patients in Remission and IBD Patients with Active Disease.
Categorical variables were reported as numbers and percentages, test used: chi-square test. Continuous variables were reported as geometric means ± Standard deviation, test used: independent t-test. p<0.05.
IBD= Inflammatory Bowel Diseases, DRI= Daily Recommended Intake, BMI= Body Mass Index, TEI= Total Energy Intake, MUFAs= Mono-unsaturated Fatty Acids, PUFAs= Poly-unsaturated Fatty Acids, SFAs= Saturated Fatty Acids, N/A= Not applicable.
Disclosures:
Lea Sayegh indicated no relevant financial relationships.
Fadi Mourad indicated no relevant financial relationships.
Nicole Fakhoury-Sayegh indicated no relevant financial relationships.
Charbel Chidiac indicated no relevant financial relationships.
Rashad Nawfal indicated no relevant financial relationships.
Fady Daniel indicated no relevant financial relationships.
Kassem Barada indicated no relevant financial relationships.
Ala Sharara indicated no relevant financial relationships.
Fadi Francis indicated no relevant financial relationships.
Jana Hashash indicated no relevant financial relationships.
Lea N. Sayegh, MD1, Fadi H. Mourad, MD1, Nicole Fakhoury-Sayegh, PhD2, Charbel Chidiac, MD1, Rashad Nawfal, 1, Fady Daniel, MD1, Kassem Barada, MD1, Ala I. Sharara, MD1, Fadi F. Francis, MD1, Jana G. Hashash, MD, MSc3. B0404 - Association Between Nutritional Profile and Disease Activity in a Sample of Lebanese Patients With Inflammatory Bowel Disease (IBD): A Case Control Study, ACG 2022 Annual Scientific Meeting Abstracts. Charlotte, NC: American College of Gastroenterology.
