Poster Session B - Monday Morning
Category: IBD
B0385 - Patients With High Visceral Adipose Tissue Burden Have a Higher Target Therapeutic Infliximab Concentrations: Should We Be Filling the VAT?


Andres Yarur, MD
Cedars-Sinai Medical Center
Los Angeles, CA
Presenting Author(s)
1Cedars-Sinai Medical Center, Los Angeles, CA; 2Medical College of Wisconsin, Milwaukee, WI; 3Washington University in St. Louis, St. Louis, MO; 4The University of Miami Health System, Miami, FL; 5Beth Israel Deaconess Medical Center, Boston, MA; 6Susan and Leonard Feinstein IBD Center, Icahn School of Medicine, Mount Sinai, New York, NY; 7Medical College of Wisconsin Affiliated Hospitals, Wauwatosa, WI; 8Cedars Sinai Medical Center, Los Angeles, CA
Introduction: In patients with Crohn’s disease (CD) or ulcerative colitis (UC), body composition (BC) and specifically visceral adipose tissue (VAT) has been associated with worse response to infliximab (IFX), potentially playing a role in clearance and volume distribution. VAT may also explain heterogenicity in target trough levels of IFX (TLI) associated with favorable outcomes. The aim of this study was to assess whether TLI cutoffs linked to efficacy in patients with CD/UC receiving IFX vary based on VAT.
Methods: We conducted a prospective cross-sectional study including patients with CD or UC receiving maintenance IFX therapy (≥ 22 weeks). Variables collected at enrollment included disease phenotype, inflammation biomarkers (c-reactive protein [CRP] and fecal calprotectin [FCal]), Harvey Bradshaw Index (HBI) and simple endoscopic score (SES-CD) in CD, partial and endoscopic Mayo score (PMS and EMS) in UC. TLI and anti-drug antibodies (ADA) were measured using a drug-tolerant assay. BC parameters were measured using a GE Lunar iDXA scan (body mass, total fat and lean mass, VAT mass). Primary outcome was steroid-free deep remission (SFDR) defined as HBI < 5 in CD and PMS< 2 in UC and a normal CRP and FCal while off corticosteroids. Secondary outcome was endoscopic remission (EMS≤1 in UC or SES-CD≤2) when colonoscopy was done within 12 weeks of index visit. Optimal ITL cutoffs for SFDR by VAT% (VAT/total body mass) were determined using the Youden J statistics (J).
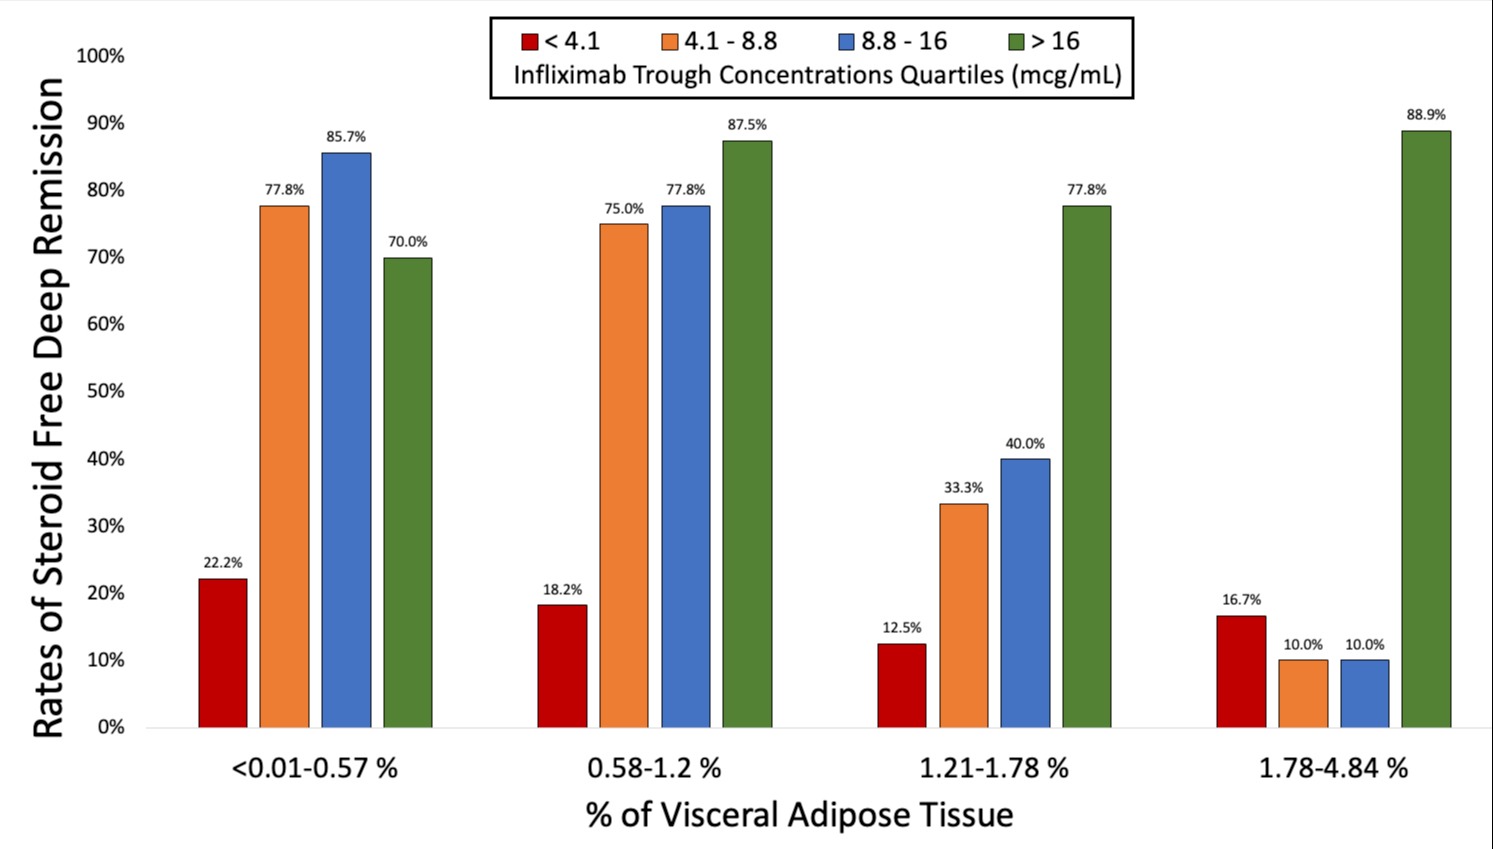
Results: Overall, 142 patients were enrolled and 110 had endoscopic assessment done. Differences between patients by SFDR status are shown in Table 1. An exposure-response association was identified across all VAT%, with higher ITL thresholds associated with higher VAT% (Figure 1). The optimal ITL cutoffs associated with SFDR and endoscopic remission were 3.9 mcg/mL (J: 0.52) and 4.9 mcg/mL (J: 0.56) for patients in the lowest two VAT% quartiles (< 1.2%) while optimal ITL cutoffs associated with SFDR and endoscopic remission for those patients in the highest two VAT% quartiles were 15.3 mcg/mL (J: 0.63) and 13.6 mcg/mL (J: 0.57), respectively.
Discussion: ITL cutoffs associated with favorable outcomes were higher in patients with high VAT%. This suggests that patients with higher VAT burden may require higher ITL vs. those with lower VAT. Clinicians should therefore consider VAT burden when interpreting ITL and performing therapeutic drug monitoring.

| Active Disease | Steroid-Free Deep Remission | P value |
Female gender [n (%)] | 40 (55.6) | 39 (55.7) | 0.99 |
Age [mean in years [SD]) | 43 (17) | 39 (17) | 0.10 |
Hispanic ethnicity [n (%)] | 3 (4.2) | 3 (4.3) | 0.97 |
Race [n (%)] Caucasian African-American Asian Other |
64 (90.1) 5 (7.0) 1 (1.4) 1 (1.4) |
62 (92.5) 5 (7.5) None None | 0.59 |
Disease Type [n (%)] Crohn’s disease Ulcerative colitis |
42 (58.3) 30 (41.7) |
45 (64.3) 25 (25.7) | 0.47 |
Active smoker at baseline [n (%)] | 5 (6.9) | 9 (12.86) | 0.24 |
Years with IBD [Median in years (IQR)] | 2 (1-8) | 1 (1-5) | 0.10 |
Crohn’s Disease Phenotype | |||
Location1 [n (%)] L1: Ileal L2: Colonic L3: Ileocolonic |
10 (13.4) 7 (9.7) 24 (33.3) |
9 (12.9) 9 (12.9) 26 (37.1) |
0.86 0.56 0.64 |
L4: Upper Gastrointestinal tract involvement [n (%)] | 2 (2.8) | 2 (2.9) | 0.98 |
B1: Not stricturing, non-penetrating [n (%)] | 16 (22.2) | 23 (32.9) | 0.16 |
B2: Stricturing [n (%)] | 22 (30.6) | 12 (17.1) | 0.06 |
B3: Penetrating [n (%)] | 9 (12.5) | 9 (12.9) | 0.95 |
Ulcerative Colitis Phenotype | |||
Ulcerative Colitis Extension2 [n (%)] Proctitis Left-sided Colitis Pan-colitis |
3 (4.2) 10 (13.9) 17 (23.6) |
1 (1.4) 4 (5.7) 20 (54.1) |
0.32 0.10 0.50 |
| |||
Total Mass [Mean in Kg (SD)] | 84.0 (21.3) | 78.0 (19.2) | 0.081 |
Body Mass Index [Mean in Kg/m2 (SD)] | 28.8 (6.3) | 26.8 (6.3) | 0.07 |
Percentage of Body Fat [Mean in % (SD)] | 48.9 (11.0) | 48.0 (10.6) | 0.62 |
Total VAT3 Mass [Mean in gr (SD)] | 1417.8 (1116.0) | 893.1 (769.0) | 0.0014* |
VAT3 percentage of total body mass [Mean in % (SD)] | 1.54 (0.96) | 1.04 (0.75) | 0.0007* |
VAT3 percentage of total fat mass [Mean in % (SD)] | 29.3 (15.3) | 20.9 (14.2) | < 0.001* |
Percentage of lean mass [Mean in Kg (SD)] | 59.3 (9.1) | 62.8 (1.3) | 0.04* |
Lean mass [Mean in Kg (SD)] | 48.9 (11.0) | 48.0 (10.6) | 0.62 |
Previous Use of Biologic [n (%)] | 16 (22.2) | 8 (11.4) | 0.086 |
Number of previous biologics4 [n (%)] 1 2 3 4 5 |
19 (42.2) 12 (26.7) 9 (20.0) None 1 (2.2) |
17 (39.5) 9 (20.9) 7 (16.3) 1 (2.3) None | 0.45 |
Use 5-aminosalicilates [n (%)] | 7 (9.7) | 5 (7.1) | 0.58 |
On combination therapy with immunomodulator [n (%)] | 30 (41.7) | 43 (61.4) | 0.019* |
Combination therapy with immunomodulator [n (%)]
None Methotrexate Azathioprine Mercaptopurine |
42 (58.3) 6 (8.3) 23 (31.9) 1 (1.4) |
28 (40.0) 11 (15.7) 28 (40.0) 3 (4.3) | 0.013* |
Simple Endoscopic Score-CD1,5 [Median (IQR)] | 8 (4-10) | 0 (0-1) | < 0.0001* |
Endoscopic Mayo Score2,5 [n (%)] 0 1 2 3 |
None 1 (3.6) 14 (50.0) 13 (46.4) |
7 (38.9) 2 (11.1) 4 (22.2) 5 (27.9) | 0.001* |
SIBDQ4 [Mean (SD)] | 50 (12.4) | 53 (12.5) | 0.271 |
Infliximab trough concentration [Median in μg/mL (IQR] | 5.7 (2.6-10.7) | 14.4 (6.3-20.6) | < 0.0001* |
Detectable anti-infliximab antibodies [n (%)] | 4 (5.6) | 2 (2.7) | 0.42 |
(1) Only patients with Crohn’s disease.
(2) Only patients with ulcerative colitis
(3) VAT: Visceral Adipose Tissue Mass.
(4) Applies to patients with previous exposure to biologic
(5) Patients with endoscopic assessment
(6) SIBDQ: Simple Inflammatory Bowel Disease Questionnaire
(*) Statistically significant
Disclosures:
Andres Yarur, MD1, Shaina Sekhri, MD2, Parakkal Deepak, MBBS, MS3, Maria T. Abreu, MD4, Adam Cheifetz, MD5, Konstantinos Papamichail, MD, PhD5, Marla C. Dubinsky, MD6, Poonam Beniwal-Patel, MD7, Phillip Gu, MD8, Dermot McGovern, MD, PhD8, Gil Y. Melmed, MD1. B0385 - Patients With High Visceral Adipose Tissue Burden Have a Higher Target Therapeutic Infliximab Concentrations: Should We Be Filling the VAT?, ACG 2022 Annual Scientific Meeting Abstracts. Charlotte, NC: American College of Gastroenterology.

