Poster Session C - Monday Afternoon
Category: Colorectal Cancer Prevention
C0172 - Long-Term Follow-Up of Colonoscopy Quality Monitoring

.jpg)
Feenalie Patel, MD
Indiana University School of Medicine
Indianapolis, IN
Presenting Author(s)
1Indiana University School of Medicine, Indianapolis, IN; 2Indiana School of Medicine, Indianapolis, IN; 3Indiana University, Indianapolis, IN
Introduction: High-quality colonoscopy is paramount to effective prevention of colorectal cancer. A variety of interventions have been proposed to monitor and improve colonoscopy quality at operator and institutional levels. Since 2009, endoscopists at our university-affiliated, Veterans Affairs Medical Center (VAMC) have received a quarterly report card summarizing individual colonoscopy quality indicators. This intervention was associated with short-term improvement in adenoma detection rate (ADR). However, long-term effects of this monitoring on colonoscopy quality metrics, and appropriate monitoring frequency, are unclear.
Methods: We conducted a retrospective study of prospectively administered quarterly colonoscopy quality report cards at a VAMC from April 1, 2012 to August 31, 2019. Anonymized reports included individual endoscopists’ ADR, cecal intubation rates, and withdrawal time. We included endoscopists who had contributed at least 50 colonoscopies per year, and at least 4 consecutive quarters during the study time frame. Linear regression models were used to determine and test slopes over time for each quality metric by physician, and to determine if slopes differed for data above vs below the median for each metric. Analyses were performed for quarterly and yearly data to assess whether there are significant differences based on monitoring frequency.
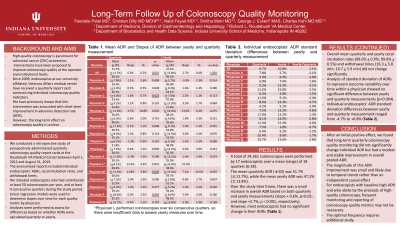
Results: Data from the report cards of 17 endoscopists who had performed 24,361 colonoscopies were included. The mean quarterly ADR (±SD) was 51.7% (±11.7%), while the mean yearly ADR was 47.2% (±13.8%). Over the study time frame, there was a small increase in overall ADR based on both quarterly and yearly measurements (slope + 0.6%, p=0.02; and slope +2.7%, p < 0.001, respectively). However, most endoscopists had no significant change in their ADRs (Table 1). Overall cecal intubation rates and withdrawal times did not change significantly. Analysis of standard deviation of ADRs (to represent outcome variability over time within a physician) showed no significant difference between yearly and quarterly measurements (p=0.064). Individual endoscopists’ ADR standard deviation differences between yearly and quarterly measurement ranged from -4.7% to +6.8%.
Discussion: Long-term colonoscopy quality monitoring was paralleled with modest improvement in overall ADR, likely due to temporal trends. For endoscopists with baseline high ADR, intensive monitoring and reporting of colonoscopy quality metrics is not necessary and could be performed annually.
| Quarterly | Yearly | ||||||
Physician | Mean (+ SD) | Slope | SE | p-value | Mean (+ SD) | Slope | SE | p-value |
All | 51.7% (+ 11.7%) | 0.6% | 0.2% | 0.021 | 47.2% (+ 13.8%) | 2.7% | 0.4% | < .001 |
Physician A | 48.5% (+ 7.8%) | 1.1% | 2.6% | 0.689 | 49.3% (+ 5.7%) | -3.0% | 2.3% | 0.314 |
Physician B | 39.4% (+ 5.4%) | 0.2% | 0.5% | 0.628 | 36.8% (+ 9.4%) | 1.6% | 1.4% | 0.306 |
Physician C | 66.3% (+ 6.0%) | 1.6% | 0.7% | 0.022 | 64.1% (+ 7.6%) | 2.3% | 1.2% | 0.113 |
Physician D | 53.4% (+ 9.2%) | 1.2% | 0.8% | 0.155 | 47.9% (+ 13.3%) | 3.5% | 1.7% | 0.084 |
Physician E | 33.8% (+ 11.5%) | 4.7% | 10.8% | 0.692 | 21.0% (+ 15.0%) | 13.6% | 6.3% | 0.275 |
Physician F | 46.4% (+ 6.3%) | 0.6% | 2.0% | 0.761 | 48.2% (+ 4.8%) | 1.8% | 2.3% | 0.531 |
Physician G | 48.0% (+ 11.5%) | 0.1% | 1.1% | 0.948 | 39.6% (+ 9.1%) | 1.9% | 1.3% | 0.201 |
Physician H | 60.3% (+ 8.6%) | 1.2% | 0.8% | 0.118 | 54.0% (+ 13.3%) | 3.6% | 1.6% | 0.070 |
Physician I | 55.1% (+ 6.2%) | -1.3% | 0.9% | 0.167 | 53.2% (+ 9.1%) | 1.4% | 2.3% | 0.589 |
Physician J | 51.8% (+ 7.5%) | 0.4% | 1.5% | 0.802 | 48.9% (+ 12.2%) | 3.6% | 3.9% | 0.431 |
Physician K | 38.5% (+ 11.0%) | -1.4% | 1.3% | 0.290 | 35.5% (+ 12.2%) | 1.6% | 2.4% | 0.533 |
Physician L | 50.1% (+ 8.1%) | 14.2% | 3.4% | 0.052 | 35.9% (+ 14.9%) | -21.0% |
|
|
Physician M | 48.2% (+ 11.3%) | 11.8% | 3.8% | 0.026 | 38.6% (+ 15.3%) | 7.1% | 13.6% | 0.692 |
Physician N | 60.0% (+ 7.5%) | 2.0% | 2.9% | 0.506 | 59.7% (+ 2.8%) | 0.8% | 2.7% | 0.819 |
Physician O | 52.9% (+ 6.4%) | 1.3% | 1.2% | 0.277 | 52.1% (+ 5.2%) | 1.9% | 1.6% | 0.302 |
Physician P | 59.1% (+ 10.4%) | 6.0% | 2.5% | 0.043 | 59.2% (+ 8.6%) | 5.6% | 2.6% | 0.160 |
Physician Q | 55.2% (+ 10.7%) | 0.4% | 1.1% | 0.747 | 48.5% (+ 13.6%) | 3.0% | 1.9% | 0.169 |
Disclosures:
Feenalie Patel, MD1, Charles J. Kahi, MD, MS2, Christen Dilly, MD, MEHP3, Smitha Marri, MD3, George J. Eckert, MAS3, Nabil Fayad, MD, MS3. C0172 - Long-Term Follow-Up of Colonoscopy Quality Monitoring, ACG 2022 Annual Scientific Meeting Abstracts. Charlotte, NC: American College of Gastroenterology.
