Poster Session C - Monday Afternoon
Category: Colorectal Cancer Prevention
C0179 - Test Characteristics of Fecal Immunochemical Tests for Colorectal Cancer and Advanced Adenomas Based on Location: A Systematic Review


Thomas F. Imperiale, MD
Indiana University School of Medicine
Indianapolis, IN
Presenting Author(s)
1Indiana University School of Medicine, Indianapolis, IN; 2Regenstrief Institute, Indianapolis, IN; 3Indiana University/Regenstrief Institute, Indianapolis, IN
Introduction: Test characteristics of fecal immunochemical tests (FITs) vary based on threshold, and may vary based on location within the colon; however, published studies are inconsistent. We conducted a systematic review to determine the effect of location on test characteristics for colorectal cancer (CRC) and advanced adenomas (AA).
Methods: We searched Ovid MEDLINE, PubMed, EMBASE, and Cochrane Library for studies on FIT where colonoscopy was the reference standard and contained FIT test characteristics based on location within the colon (μg/g). Two authors independently reviewed all citations to identify relevant studies, abstracted study characteristics and numerical data, and assessed study quality (QUADAS). For summary-level estimates, we used a univariate generalized linear mixed model to simultaneously estimate pooled sensitivity and specificity separately for CRC and advanced adenomas. We compared proximal and distal sensitivity for CRC and AA in pre-specified groups based on specific FIT or threshold using random effects logistic regression with a test for differences between subgroups.
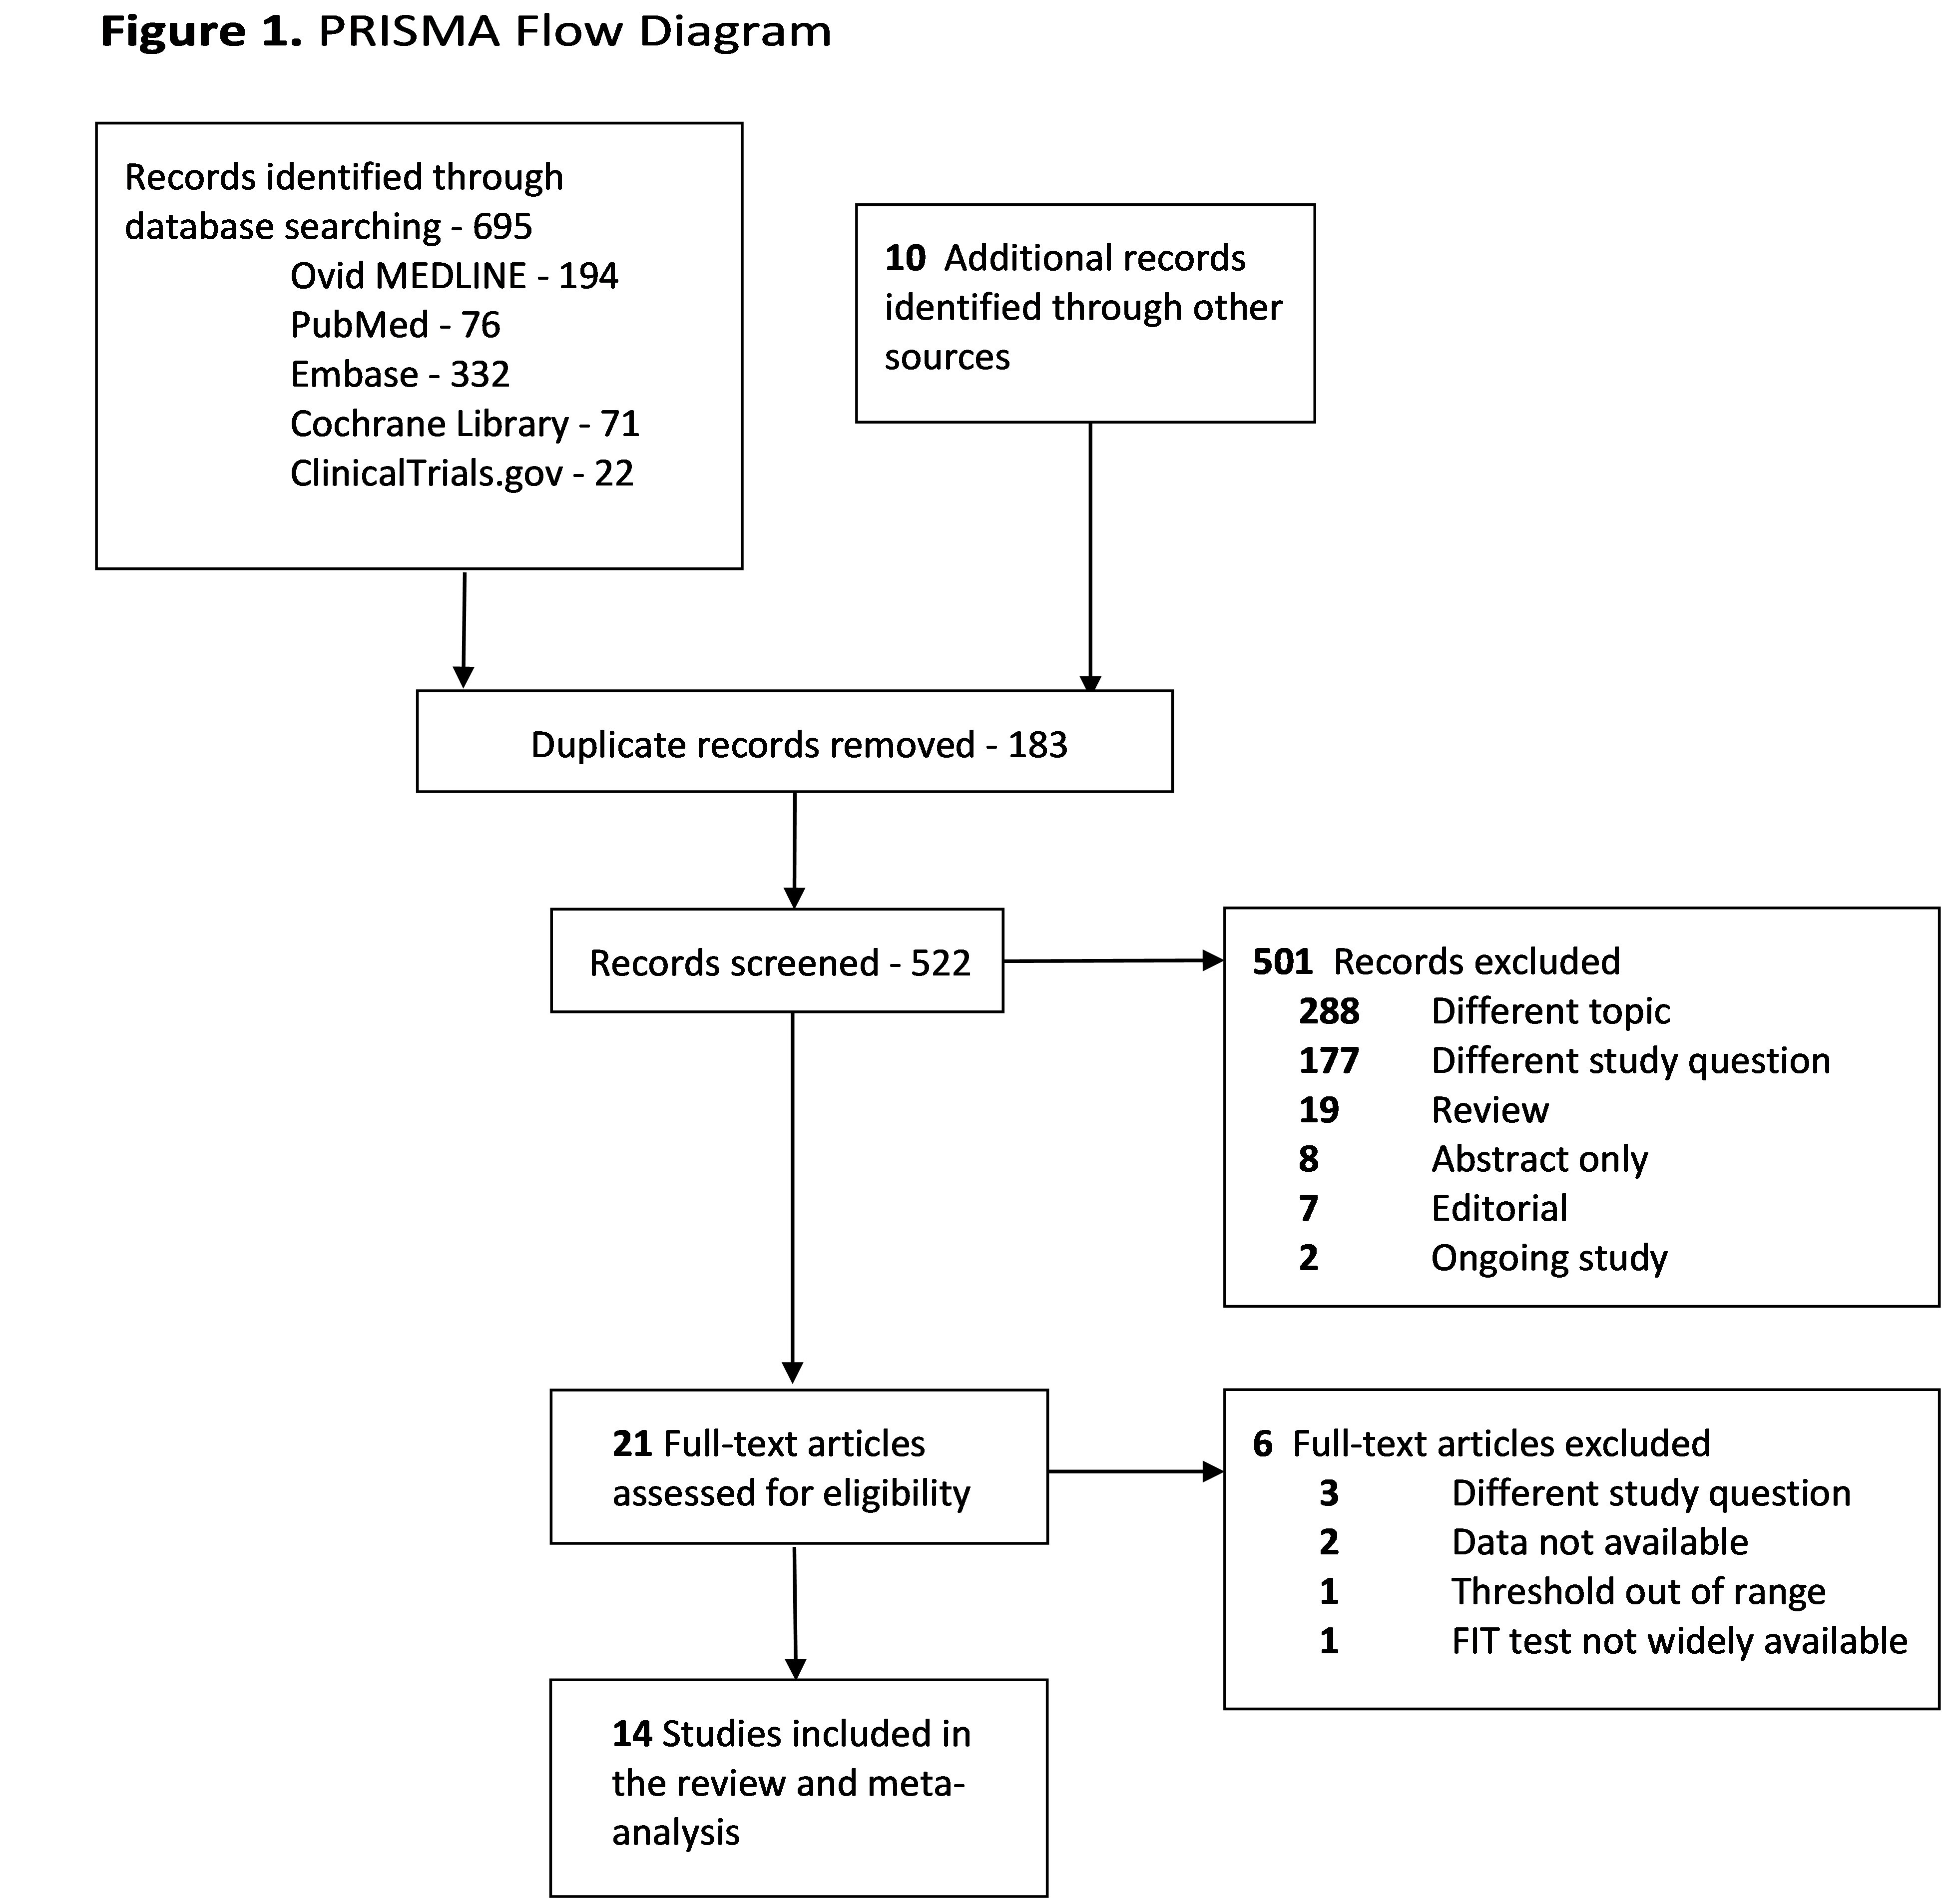
Results: From 705 titles, we reviewed 522 unique citations and abstracts when available, from which we reviewed 21 full-text articles, selecting 14 articles meeting inclusion criteria (Figure). The 14 studies included 30 FIT analyses and examined 10 different FITs, 5 of which were tested at > 1 threshold. Mean patient age (11 studies) was 59.4 years; 64.3% (13 studies) were women. All studies were of high quality. Among 34,790 individuals, there were 259 (94 proximal, 165 distal) CRCs (0.7%) and 2450 (1097 proximal, 1371 distal AAs (7.0%). Test characteristics for proximal and distal CRC and AA by threshold are in the Table. For both CRC and AA, test characteristics varied by threshold, but not location. For CRC, the < 10 µg/g threshold had the greatest numerical difference in sensitivity: 0.86 proximal vs 0.76 distal, but was not statistically significant (P=0.76). For AA, the ≥ 20 µg threshold had the largest numerical difference: 0.14 proximal vs. 0.24 distal) but did not reach statistical significance (P = 0.0518). All other comparisons were not statistically significant (P > 0.85 for CRC and P > 0.21 for AA).
Discussion: In this systematic review of FIT test characteristics for CRC and AA, we found that test characteristics varied by threshold. For the most used test thresholds, sensitivity for AA was numerically greater for the distal colon, but none of the differences was statistically significant.

| Univariate Summary Results for Colorectal Cancer (CRC) |
| ||||||||
|
|
|
| Proximal | Distal | P-value1 | ||||
Threshold (µg/g) | N of Subjects | N of CRCs Proximal | N of CRCs Distal | N of Studies | Sensitivity [95% CI] | Specificity [95% CI] | N of Studies | Sensitivity [95% CI] | Specificity [95%CI] | Proximal vs distal (sensitivity only) |
< 10 (all studies) | 4074 | 7 | 21 | 3 | 0.86 [0.42; 0.98] | 0.90 [0.82; 0.94] | 2 | 0.76 [0.54; 0.90] | 0.91 [0.81; 0.96] | ---- |
< 10 (excluding Graser 2009) | 3789 | 6 | 21 | 2 | 0.83 [0.37; 0.98] | 0.91 [0.81; 0.96] | 2 | 0.76 [0.54; 0.90] | 0.91 [0.81; 0.96] | 0.71 |
10 (all studies) | 13476 | 34 | 85 | 6 | 0.74 [0.56; 0.86] | 0.93 [0.88; 0.96] | 5 | 0.74 [0.57; 0.86] | 0.91 [0.87; 0.94] | ---- |
10 (excluding Levy 2014) | 13259 | 33 | 85 | 5 | 0.76 [0.58; 0.87] | 0.91 [0.87; 0.94] | 5 | 0.74 [0.57; 0.86] | 0.91 [0.87; 0.94] | 0.86 |
11-19 | 14882 | 43 | 104 | 6 | 0.81 [0.52; 0.94] | 0.93 [0.88; 0.95] | 6 | 0.81 [0.68; 0.90] | 0.93 [0.88; 0.95] | 0.99 |
>=20 | 18675 | 81 | 142 | 10 | 0.75 [0.65; 0.83] | 0.95 [0.93; 0.97] | 10 | 0.76 [0.68; 0.82] | 0.95 [0.93; 0.97] | 0.90 |
| Univariate Summary Results for Advanced Adenoma (AA) |
| ||||||||
|
|
|
| Proximal | Distal |
| ||||
Threshold µg/g | N of Subjects | N of AA Proximal | N of AA Distal | N of Studies | Sensitivity [95%CI] | Specificity [95% CI] | N of Studies | Sensitivity [95% CI] | Specificity [95% CI] |
|
< 10 | 4074 | 112 | 239 | 3 | 0.25 [0.14; 0.40] | 0.90 [0.82; 0.94] | 3 | 0.32 [0.26; 0.38] | 0.90 [0.82; 0.94] | 0.38 |
10 | 13805 | 370 | 552 | 7 | 0.2090 [0.12; 0.35] | 0.94 [0.90; 0.96] | 7 | 0.31 [0.23; 0.40] | 0.94 [0.89; 0.96] | 0.21 |
11-19 | 14882 | 449 | 664 | 6 | 0.26 [0.17; 0.39] | 0.93 [0.88; 0.95] | 6 | 0.32 [0.23; 0.42] | 0.93 [0.88; 0.95] | 0.51 |
>=20 | 19750 | 942 | 1172 | 14 | 0.14 [0.08; 0.22] | 0.95 [0.93; 0.96] | 14 | 0.24 [0.18; 0.32] | 0.95 [0.93; 0.96] | 0.0518 |
Note: Univariate summary estimates are shown for both sensitivity and specificity with 95% confidence intervals in brackets. Estimates were obtained using a random effects logistic regression model. 1P-value for difference between proximal and distal sensitivity from random effects logistic regression model. | ||||||||||
Disclosures:
Thomas F. Imperiale, MD1, Sarah M. Roth, MHA, MPH2, Nick R. Imperiale, BS3, Timothy E. Stump, MA1, Amy E. Blevins, MALS1, Patrick O. Monahan, PhD1. C0179 - Test Characteristics of Fecal Immunochemical Tests for Colorectal Cancer and Advanced Adenomas Based on Location: A Systematic Review, ACG 2022 Annual Scientific Meeting Abstracts. Charlotte, NC: American College of Gastroenterology.
