Poster Session C - Monday Afternoon
Category: Colorectal Cancer Prevention
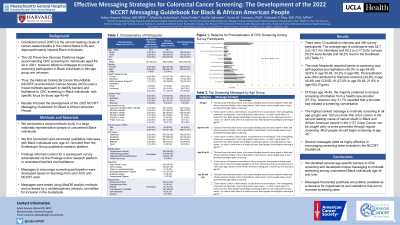
C0185 - Effective Messaging Strategies for Colorectal Cancer Screening: The Development of the 2022 NCCRT Messaging Guidebook for Black and African American People


Adjoa Anyane-Yeboa, MD, MPH
Faculty Gastroenterologist
Massachusetts General Hospital
Boston, MA
Presenting Author(s)
1Massachusetts General Hospital, Boston, MA; 2KS & R, Syracuse, NY; 3Ally Research Partners LLC, Atlanta, GA; 4National Colorectal Cancer Roundtable, Kennesaw, GA; 5Harvard T.H. Chan School of Public Health, Boston, MA; 6UCLA, David Geffen School of Medicine, Los Angeles, CA
Introduction: Colorectal cancer (CRC) is the second leading cause of cancer-related deaths in the United States (US) and disproportionately impacts Black individuals. The US Preventive Services Taskforce began recommending CRC screening for individuals aged 45-49 in 2021, however effective strategies to increase screening participation in Black individuals in this age group are unknown. Thus, the National Colorectal Roundtable (NCCRT) used a mixed methods approach to identify barriers and facilitators to CRC screening in Black individuals, with specific focus on those age 45-49. Results informed the development of the 2022 NCCRT Messaging Guidebook for Black & African American People.
Methods: We conducted a mixed-methods study in a large, nationally representative sample of unscreened Black individuals. We first conducted semi-structured qualitative interviews with Black individuals over age 45, recruited from the Schlesinger Group qualitative research platform. Findings informed content for a subsequent survey to understand barriers and facilitators, administered broadly via the Prodege online research platform. Messages to encourage screening participation were developed based on learnings from prior ACS and NCCRT work. Message were tested using MaxDiff analytic methods and reviewed by a multidisciplinary advisory committee for inclusion in the Guidebook.
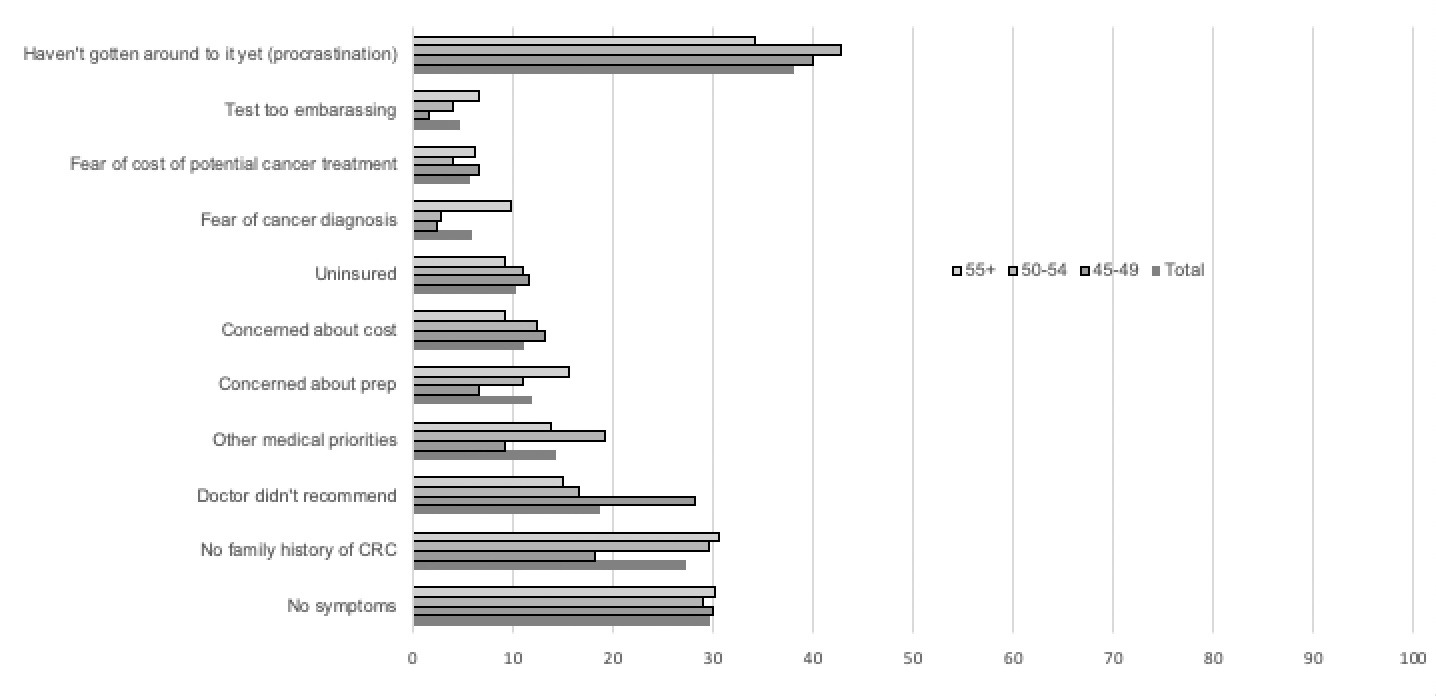
Results: There were 10 qualitative interview and 490 survey participants. The average age of participants was 52.7 (s.d.=6.1) for interviews and 55.3 (s.d.=7.3) for surveys. 40.0% were female and 38.2% lived in the Southeast US (Table). The most frequently reported barrier to screening was procrastination (40.0% in age 45-49; 42.8% in age 50-65; 34.2% in age >55). Procrastination was often attributed to financial concerns (20.8% in age 45-49) and COVID-19 (27.0% in age 50-54; 21.8% in age >55) (Figure). Of those age 45-49, the majority preferred to receive screening information from a health care provider (57.5%), however only 31.7% reported that a provider had initiated a screening conversation. Several messages rated as highly effective in encouraging screening were included in the NCCRT Guidebook.
Discussion: We identified several age-specific barriers to CRC screening and developed unique messaging to motivate screening among unscreened Black individuals age 45 and over. Messages that tested positively are publicly available as a resource for organizations and institutions that aim to increase screening rates.

x - axis label: percentage
Characteristics Mean (s.d.) or N, % | Qualitative Interview participants Mean or N (%) | Survey participants Mean or N (%) | Total Participants N (%) | |
Age – Mean 45-49 50-54 55+ | 52.7 3 (30.0%) 2 (20.0%) 5 (50.0%) | 55.3 120 (24.5%) 145 (29.6%) 225 (45.9%) |
123 (24.6%) 147 (29.4%) 230 (46.0%) | |
Race Black |
10 (100.0%) |
490 (100%) |
500 (100.0%) | |
Gender Female Male Other |
4 (40.0%) 6 (60.0%) 0 (0%) |
262 (53.5%) 226 (46.1%) 2 (0.4%) |
266 (53.2%) 232 (46.4%) | |
Health insurance type Private Medicare State Insurance Program** VA/military Other Uninsured |
6 (60.0%) 0 (0.0%) 1 (10.0%)
0 (0.0%) 1 (10.0%) 2 (20.0%) |
153 (37.1%) 111 (26.9%) 119 (28.8%)
15 (3.6%) 38, (9.2%) 77, (15.7%) |
159 (31.8%) 111 (22.2%) 120 (24.0%)
15 (3.0%) 39 (7.8%) 79 (15.8%) | |
Location Type Urban Suburban Rural Not sure |
5 (50.0%) 4 (40.0%) 1 (10.0%) 0 (0.0%) |
215 (43.9%) 211 (43.1%) 62 (12.7%) 2 (0.4%) |
220 (44.0%) 215 (43.0%) 63 (12.6%) 2 (0.4%) | |
Household Income Less than 12,000 12,000 to 39,999 40,000 to 59,999 60,000 to 79,000 80,000 to 99,999 100,000 or more Prefer not to say |
1 (10.0%) 2 (20.0%) 2 (20.0%) 1 (10.0%) 1 (10.0%) 3 (30.0%) 0 (0.0%) |
63 (12.9%) 187 (38.2%) 98 (20.0%) 53 (10.8%) 22 (4.5%) 49 (10.0%) 18 (3.7%) |
64 (12.8%) 189 (37.8%) 100 (20.0%) 54 (10.8) 23 (4.6%) 52 10.4) 18 (3.6%) | |
Family history of CRC Yes No |
2 (20.0%) 8 (80.0%) |
43 (8.8%) 447 (91.2%) |
45 (9.0%) 455 (91.0%) | |
US Region Northeast Southeast Southwest Midwest West |
2 (20.0%) 4 (40.0%) 0 (0.0%) 3 (30.0%) 1 (10.0%) |
100 (20.4%) 187 (38.2%) 69 (14.1%) 90 (18.4%) 44 (9.0%)
|
102 (20.4%) 191 (38.2%) 69 (13.8%) 93 (18.6%) 45 (9.0%)
| |
Marital status Single/never married Married/living partner Separated/Divorced/Widowed Prefer not to say | Not Asked |
195 (39.8%) 174 (35.5%) 118 (24.1%) 3 (0.6%) |
| |
Education High school or less Some college Trade or vocational training Associates or Bachelors’ Degree Graduate degree Postgraduate Degree | Not Asked |
144 (29.4%) 136 (27.8%) 21 (4.3%) 137 (27.9%) 41 (8.4%) 11 (2.2%) |
| |
Employment Employed full time Employed part time Retired Unemployed or disabled Self-employed Student | Not Asked |
183 (37.3%) 42 (8.6%) 77 (15.7%) 142 (29.0%) 40 (8.2%) 6 (1.2%) |
| |
|
| |||
Disclosures:
Adjoa Anyane-Yeboa, MD, MPH1, Michelle Aubertine, BS2, Aisha Parker, BA3, Kaitlin Sylvester, MPA4, Karen M. Emmons, PhD5, Folasade P. May, MD, PhD, MPhil6. C0185 - Effective Messaging Strategies for Colorectal Cancer Screening: The Development of the 2022 NCCRT Messaging Guidebook for Black and African American People, ACG 2022 Annual Scientific Meeting Abstracts. Charlotte, NC: American College of Gastroenterology.

