Poster Session D - Tuesday Morning
Category: IBD
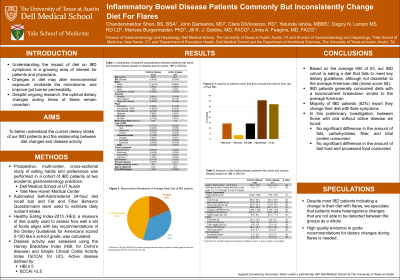
D0357 - Inflammatory Bowel Disease Patients Commonly but Inconsistently Change Diet for Flares


Chandershekhar Shori, BS, BSA
University of Texas at Austin
Frisco, TX
Presenting Author(s)
1University of Texas at Austin, Austin, TX; 2Yale University School of Medicine, New Haven, CT; 3University of Texas at Austin Dell Medical School, Austin, TX
Introduction: Of growing interest for patients and physicians is understanding the impact of diet on IBD symptoms. Changing diet may alter environmental exposure, modulate the microbiome, and improve gut barrier permeability. Despite ongoing research, the optimal dietary changes during times of flares remain uncertain. We aimed to better understand the current dietary intake of our IBD patients and the relationship between diet changes and disease activity.
Methods: A prospective, multi-center, cross-sectional study of eating habits and preferences was performed in a cohort of IBD patients at two academic gastroenterology practices. The Automated Self-Administered 24-hour diet recall tool and Fat and Fiber Behavior Questionnaire were used to estimate daily nutrient intake. Healthy Eating Index-2015(HEI), a measure of diet quality used to assess how well a set of foods aligns with key recommendations of the Dietary Guidelines for Americans scored 0-100 like a school grade, was calculated. Disease activity was assessed using the Harvey Bradshaw Index (Crohn’s disease) and Simple Clinical Colitis Activity Index (UC).
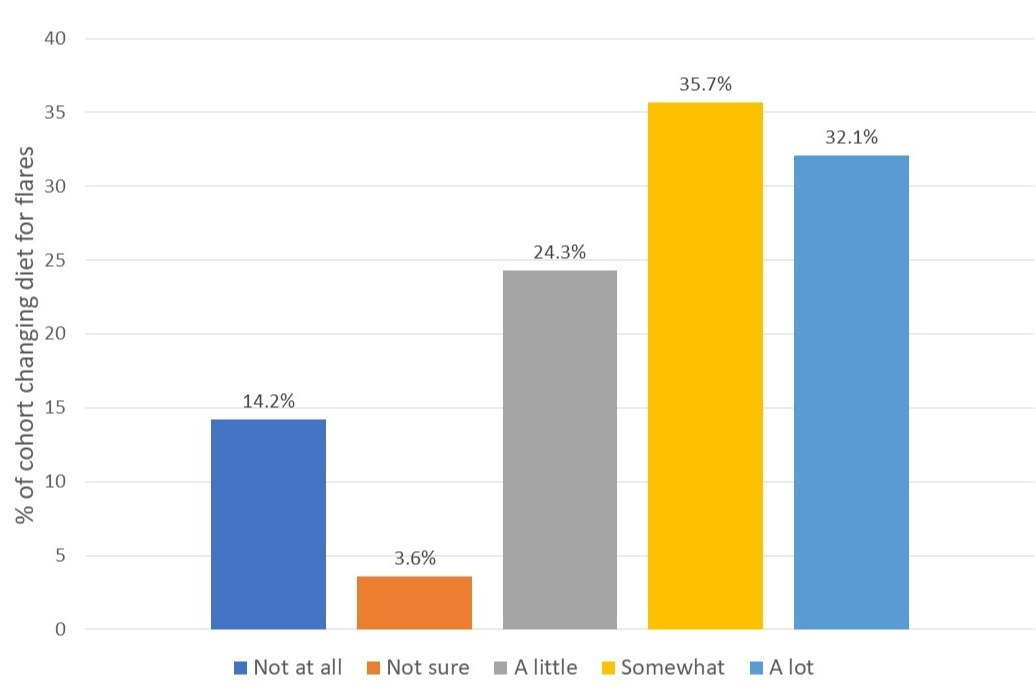
Results: In this prelim analysis, 28 patients (18 Crohn’s, 8 UC, 2 IBDU) completed all study surveys. The overall cohort consumed an avg daily diet with a HEI of 53.5 (an “F”), 2023 kcal, 19% protein, 36% fat, 46% carbohydrates with 20g of fiber, 0.7 cup equivalents of fruit, 2.1 cup equivalents of vegetables, 9.8g added sugars. On questioning, a majority of patients (92%) reported that they change their diets during flares (fig 1). To better understand these changes, we compared nutrient intake between patents with active versus inactive disease based on activity indices. We found no significant differences between the groups in regard to intake though there was a modest trend towards lower vegetable intake and lower fiber intake in those with more disease activity (table 1).
Discussion: Based on the average HEI, our cohort is eating a diet that fails to meet key dietary guidelines, although not dissimilar to the average American, mean score 57. Interestingly, while a majority report they change their diet with flare symptoms, we did not find significant differences between dietary components in those with and without active disease. We speculate that patients make varied changes in diet during flares that are not able to be detected between the groups as a whole. High quality evidence to guide recommendations for dietary changes during flares is needed.

Dietary Component | Inactive disease (n=21) | Active disease (n=7) | p-value |
Healthy Eating Index – 2015 Score | 53.5 ± 16.0 | 53.4 ± 19.3 | .99 |
Self-reported diet changes with flare (Likert scale 1-5, 1=no change, 5=a lot of change) | 3.4 ± 1.5 | 4 ± 1.4 | .38 |
Total Calories (kcal) | 2126 ± 1062 | 1715 ± 764 | .47 |
FATS |
|
|
|
Total Fat (g) | 88.0 ± 59.2 | 72.5 ± 44.0 | .64 |
Monounsaturated fat (g) | 31.6 ± 22.4 | 24.5 ± 14.2 | .60 |
Polyunsaturated fat (g) | 22.3 ± 15.3 | 21.9 ± 16.1 | .64 |
Saturated fat (g) | 26.0 ± 20.9 | 20.7 ± 12.7 | .76 |
Omega-3 (EPA/DHA) (g) | 0.035 ± .029 | .144 ± .224 | .89 |
CARBOHYDRATES (g) | 237.5 ± 117.1 | 196.2 ± 89.0 | .27 |
Added sugar (tsp. eq.) | 9.6 ± 9.6 | 10.5 ± 11.4 | .92 |
FIBER |
|
|
|
Total fiber (g) | 22.4 ± 15.5 | 12.6 ± 5.1 | .16 |
Total fruit (cup eq.) | .65 ± .93 | .83 ± .61 | .48 |
Total veggie (cup eq.) | 2.4 ± 1.8 | 1.3 ± 1.0 | .14 |
TOTAL PROTEIN (g) | 99.2 ± 56.7 | 73.5 ± 33.0 | .32 |
Red meat intake* | 3.6 ± 0.7 | 3.9 ± 0.7 | .56 |
PROCESSING |
|
|
|
Processed meats* | 4.1 ± 0.9 | 3.9 ± 0.7 | .45 |
Fast Foods* | 3.9 ± 0.9 | 3.6 ± 0.5 | .38 |
* Data from Fat and Fiber Behavior Questionnaire (FFBQ), scored 1-5, lower = higher consumption
Disclosures:
Chandershekhar Shori, BS, BSA1, John Damianos, MD2, Clara DiVincenzo, RD3, Yetunde Ishola, MBBS3, Dagny Larson, RD, LD1, Marissa Burgermaster, PhD1, Jill K. Gaidos, MD2, Linda A. Feagins, MD, FACG3. D0357 - Inflammatory Bowel Disease Patients Commonly but Inconsistently Change Diet for Flares, ACG 2022 Annual Scientific Meeting Abstracts. Charlotte, NC: American College of Gastroenterology.
