Poster Session E - Tuesday Afternoon
Category: Colorectal Cancer Prevention
E0164 - Gender Differences and Disparities in Non-Malignant Colorectal Polyp Surgery in United States
.jpg)
Deepa Wosti, MBBS
Chitwan Medical College
Kathmandu, Bagmati, Nepal
Presenting Author(s)
1Chitwan Medical College, Kathmandu, Bagmati, Nepal; 2Mayo Clinic Jacksonville, Jacksonville, FL; 3B.P. Koirala Institute of Health Sciences, Jankpurdham, Janakpur, Nepal
Introduction: Cancer related death due to colorectal cancer is the third leading cause in both men and women. Annually, more than 1.1 million cases of colon cancer are diagnosed globally. The incidence rates of colorectal cancer are higher in men than in women. Most of the colon cancer are sporadic and arise from benign adenomas. Despite advancement in endoscopic management of large colorectal polyps, colectomies are still performed in United States. In addition, there is inadequate evidence of gender differences in surgery for nonmalignant colorectal polyps and prognosis. This study aims to examine the disparities/gender differences in surgery for non-malignant polyps from the National inpatient database.
Methods: This is a retrospective cohort study involving hospitalizations between January 1, 2012, and December 31, 2019, from the National Inpatient Sample (NIS). Our study sample included discharged adult patients (≥18 years old) hospitalized for non-malignant colonic or anorectal polyp as principal diagnosis and who underwent colectomy or proctectomy as a primary procedure. The principal or primary diagnosis is the unique diagnosis during the hospitalization for which the patient was primarily admitted or treated (NIS first diagnosis variable “I10_DX1”). The primary outcome of our study is to evaluate the disparities in surgical resection of nonmalignant colorectal polyp admissions over the above period. We used descriptive statistics to present patient demographics and hospital characteristics. Rates of in-hospital mortality is expressed as per 100,000 hospitalizations with surgery for principal nonmalignant colorectal polyp.
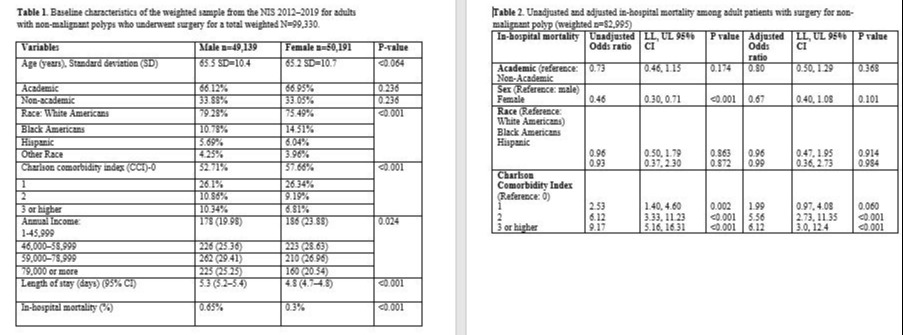
Results: There were 99330 primary admissions for surgical resection of non-malignant polyp resection in the United States from year 2012 to 2019. Fifty one percent were female (n=50191) and 66 % cases (n=59407) from academic hospitals. Majority were White Americans. Males had higher range of income threshold compared to females (p=0.001). However, females had significantly lesser in-hospital mortality, lower length of hospital stay, and less severe medical comorbidities (p=0.001) Tables 1 and 2.
Discussion: There was a significant decrease in-hospital mortality and lower length of hospital stay in females after surgery for non-malignant colorectal polyps over study periods. It is very important to understand the sociocultural differences and gender specific strategies for treatment.

Table 2. Unadjusted and adjusted in-hospital mortality among adult patients with surgery for non-malignant polyp (weighted n=82,995)
Table 1. Baseline characteristics of the weighted sample from the NIS 2012–2019 for adults
with non-malignant polyps who underwent surgery for a total weighted N=99,330.
Variables | Male n=49,139 | Female n=50,191 | P-value |
Age (years), Standard deviation (SD) | 65.5 SD=10.4 | 65.2 SD=10.7 | < 0.064 |
Academic | 66.12% | 66.95% | 0.236 |
Non-academic | 33.88% | 33.05% | 0.236 |
Race: White Americans | 79.28% | 75.49% | < 0.001 |
Black Americans | 10.78% | 14.51% | |
Hispanic | 5.69% | 6.04% | |
Other Race | 4.25% | 3.96% | |
Charlson comorbidity index (CCI)-0 | 52.71% | 57.66% | < 0.001 |
1 | 26.1% | 26.34% | |
2 | 10.86% | 9.19% | |
3 or higher | 10.34% | 6.81% | |
Annual Income: 1-45,999 | 178 (19.98) | 186 (23.88) | 0.024 |
46,000–58,999 | 226 (25.36) | 223 (28.63) | |
59,000–78,999 | 262 (29.41) | 210 (26.96) | |
79,000 or more | 225 (25.25) | 160 (20.54) | |
Length of stay (days) (95% CI) | 5.3 (5.2–5.4) | 4.8 (4.7–4.8) | < 0.001 |
In-hospital mortality (%) | 0.65% | 0.3% | < 0.001 |
AMI | 5.79% | 2.56% | < 0.001 |
CHF | 4.93% | 3.68% | < 0.001 |
PVD | 4.21% | 1.99% | < 0.001 |
CEVD | 1.73% | 1.53% | 0.287 |
Dementia | 0.37% | 0.43% | 0.501 |
COPD | 14.96% | 18.16% | < 0.001 |
Rheumatoid Disease | 1.10% | 2.33% | < 0.001 |
Hemiplegia | 0.19% | 0.07% | 0.018 |
Kidney disease | 8.07% | 5.17% | < 0.001 |
Cancer | 1.97% | 1.32% | < 0.001 |
Peptic ulcer | 0.54% | 0.40% | 0.176 |
Mild liver disease | 1.47% | 1.11% | 0.027 |
Moderate/severe liver disease | 0.52% | 0.25% | 0.003 |
Metastatic cancer | 0.28% | 0.24% | 0.580 |
AIDS | 0.04% | 0.02% | 0.448 |
Diabetes mellitus | 21.97% | 18.57% | < 0.001 |
Complication of DM | 3.79% | 2.34% | < 0.001 |
Unadjusted and adjusted in-hospital mortality among adult patients with surgery for non-malignant polyp (weighted n=82,995) | |||
In-hospital mortality | Unadjusted Odds ratio | LL, UL 95% CI | P value | Adjusted Odds ratio | LL, UL 95% CI | P value |
Academic (reference: Non-Academic | 0.73 | 0.46, 1.15 | 0.174 | 0.80 | 0.50, 1.29 | 0.368 |
Sex (Reference: male) Female |
0.46 |
0.30, 0.71 |
< 0.001 |
0.67 |
0.40, 1.08 |
0.101 |
Race (Reference: White Americans) Black Americans Hispanic |
0.96 0.93 |
0.50, 1.79 0.37, 2.30 |
0.863 0.872 |
0.96 0.99 |
0.47, 1.95 0.36, 2.73 |
0.914 0.984 |
Charlson Comorbidity Index (Reference: 0) 1 2 3 or higher |
2.53 6.12 9.17 |
1.40, 4.60 3.33, 11.23 5.16, 16.31 |
0.002 < 0.001 < 0.001 |
1.99 5.56 6.12 |
0.97, 4.08 2.73, 11.35 3.0, 12.4 |
0.060 < 0.001 < 0.001 |
Disclosures:
Deepa Wosti, MBBS1, Pujan Kandel, MD2, Dipesh Rohita, MBBS3, Bhaumik Brahmbhatt, MD2, Massimo Raimondo, MD2. E0164 - Gender Differences and Disparities in Non-Malignant Colorectal Polyp Surgery in United States, ACG 2022 Annual Scientific Meeting Abstracts. Charlotte, NC: American College of Gastroenterology.
