Poster Session B - Monday Morning
Category: Colorectal Cancer Prevention
B0163 - Effect of Healthcare Disparities and Socioeconomic Factors on Adenoma Detection Rates During COVID-19 Pandemic


Rajat Garg, MD
Cleveland Clinic Foundation
Cleveland, Ohio
Presenting Author(s)
1Cleveland Clinic, Cleveland, OH; 2Cleveland Clinic Foundation, Cleveland, OH; 3Central Michigan University College of Medicine, Saginaw, MI; 4Cleveland Clinic, Cleveland, OH; 5Digestive Disease and Surgery Institute, Cleveland Clinic, Cleveland, OH
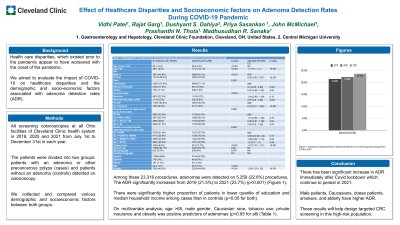
Introduction: Health care disparities, which existed prior to the pandemic appear to have worsened with the onset of the pandemic. These are especially pronounced for health maintenance measures such as screening colonoscopy which is the cornerstone of colorectal cancer (CRC) prevention. In this study, we aimed to evaluate the impact of COVID-19 on healthcare disparities and the demographic and socio-economic factors associated with adenoma detection rates (ADR).
Methods: We identified all patients who underwent colonoscopy at all Ohio facilities of the Cleveland Clinic health system in 2019, 2020, and 2021 from July 1st to December 31st in each year. The timeline of July 1st to December 31st was selected based on lockdown which lasted till the end of June 2020 in Ohio. The patients were divided into two groups: patients with an adenoma or other precancerous polyps (cases) and patients without an adenoma (controls) detected on colonoscopy. We collected and compared various demographic and socioeconomic factors between both groups.
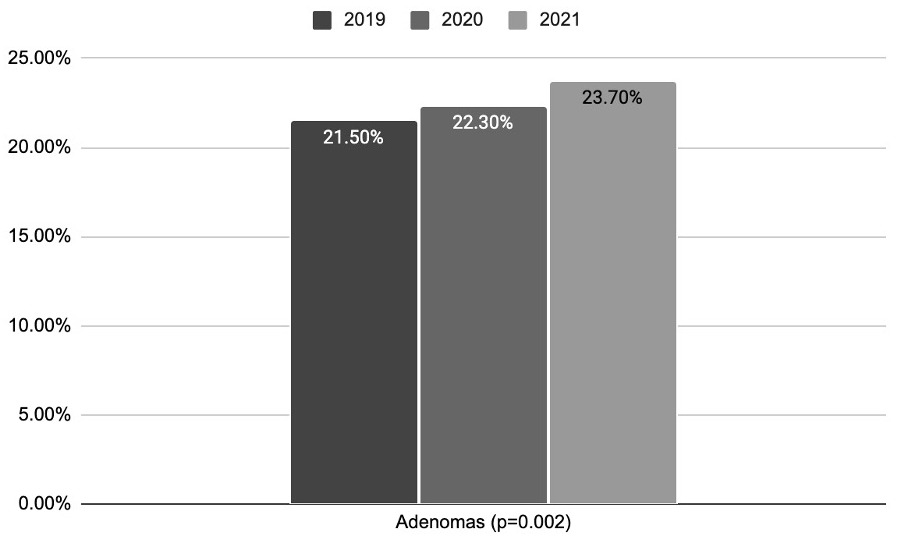
Results: A total of 23,316 screening colonoscopies were performed in Cleveland Clinic, Ohio during the study period. Among these 23,316 procedures, adenomas were detected on 5,259 (22.6%) procedures. The ADR significantly increased from 2019 (21.5%) to 2021 (23.7%) (p< 0.001) (Figure 1). As compared to controls, there was significantly higher number of elderly patients, males, and Caucasians among the cases. Patients with private insurance (58.3% vs. 62.6%) had significantly decreased ADR whereas patients with Medicare (27% vs. 22.3%) and Medicaid (6.8% vs 6.2%) had higher rates of ADR as compared to controls. There was a significantly higher proportion of patients in the lower quartile of education and median household income among cases than in controls (p< 0.05 for both). Patients with tobacco use also had significantly higher ADR whereas alcohol use, Illicit drug use, and preferred language was not significantly associated with higher ADR (p >0.05 for all). On multivariate analysis, age >65, male gender, Caucasian race, tobacco use, private insurance, and obesity were positive predictors of adenomas (p< 0.05 for all) (Table 1).
Discussion: There has been significant increase in ADR immediately after Covid lockdown which continue to persist in 2021. Male patients, Caucasians, obese patients, smokers, and elderly have higher ADR. These results will help design targeted CRC screening in this high-risk population.

Figure 1 showing increasing trends of adenoma detection on screening colonoscopy from 2019 to 2021.
Table 1: Demographic, socioeconomic factors associated with adenoma detection on screening colonoscopy | |||||
No Adenoma (N=18057) | Adenoma (N=5259) | Adjusted OR (95% CI) | p-value | ||
Age (mean ± sd) | 59.1 ± 8.9 | 60.6 ± 9.0 | < 0.001 | NA |
|
Age >=65 | 4877 (27%) | 1741 (33.1%) | < 0.001 | 1.7 (1.6 - 1.7) | < 0.001 |
Sex |
|
| |||
Male =1 | 7873 (43.6%) | 2896 (55.1%) | < 0.001 | REF |
|
Female | 10184 (56.4%) | 2363 (44.9%) | 0.65 (0.62 - 0.67) | < 0.001 | |
Race | 0.003 |
|
| ||
Caucasians | 13621 (75.4%) | 4054 (77.1%) | REF |
| |
African Americans | 3145 (17.4%) | 810 (15.4%) | 0.9 (0.85 - 0.96) | 0.001 | |
Others | 1291 (7.1%) | 395 (7.5%) | 0.97 (0.89 - 1.05) | 0.54 | |
Insurance type | < 0.001 |
|
| ||
Medicare | 4033 (22.3%) | 1419 (27%) | 1.04 (0.98 - 1.09) | 0.15 | |
Medicaid and other public | 1111 (6.2%) | 356 (6.8%) | 0.87 (0.8 - 0.94) | 0.001 | |
Private | 11297 (62.6%) | 3067 (58.3%) | REF |
| |
No insurance | 1616 (8.9%) | 417 (7.9%) | 0.76 (0.71 - 0.82) | < 0.001 | |
Education level (% high school grads in zip code) | 0.008 |
|
| ||
Q1< 88 | 3887 (22.6%) | 1143 (22.7%) | REF |
| |
Q2 >=88 to < 92.5 | 3973 (23.1%) | 1268 (25.1%) | 1.01.(0.94 - 1.08) | 0.79 | |
Q3 >= 92.5 to < 94 | 3962 (23%) | 1153 (22.9%) | 0.99 (0.91 - 1.08) | 0.82 | |
Q4 >= 94 | 5380 (31.3%) | 1478 (29.3%) | 0.99 (0.9 - 1.09) | 0.87 | |
Median household income (Quartiles based on Zip code) | 0.005 |
|
| ||
Q1 < 43449 | 3759 (21.9%) | 1147 (22.7%) | REF |
| |
Q2 >=43449 to < 55969 | 4113 (23.9%) | 1220 (24.2%) | 0.96 (0.0.90-1.03) | 0.37 | |
Q3 >= 55969 to < 67917 | 4288 (24.9%) | 1324 (26.3%) | 1.08 (0.98 - 1.18) | 0.09 | |
Q4 >= 67917 | 5042 (29.3%) | 1351 (26.8%) | 1.0 (0.9 - 1.1) | 0.99 | |
Tobacco Use | 1549 (8.6%) | 613 (11.7%) | < 0.001 | 1.41 (1.32 - 1.51) | < 0.001 |
Alcohol use | 11686 (64.7%) | 3404 (64.7%) | 0.99 | NA |
|
Illicit drug use | 622 (3.4%) | 208 (4%) | 0.079 | NA |
|
Preferred language | 0.3 | NA |
| ||
English | 17690 (98%) | 5144 (97.8%) |
|
| |
Spanish | 176 (1%) | 48 (0.9%) |
|
| |
Others | 191 (1.1%) | 67 (1.3%) |
|
| |
BMI | 29.5 ± 6.5 | 30.3 ± 6.5 | < 0.001 |
|
|
Obesity | 7200 (40.3%) | 2333 (44.8%) | < 0.001 | 1.28 (1.23-1.33) | < 0.001 |
Disclosures:
Vidhi Patel, MD1, Rajat Garg, MD2, Dushyant S. Dahiya, MD3, Priya Sasankan, MD, MBA2, John McMichael, PhD2, Prashanthi Thota, MD4, Madhusudhan Sanaka, MD5. B0163 - Effect of Healthcare Disparities and Socioeconomic Factors on Adenoma Detection Rates During COVID-19 Pandemic, ACG 2022 Annual Scientific Meeting Abstracts. Charlotte, NC: American College of Gastroenterology.
