Poster Session E - Tuesday Afternoon
Category: IBD
E0355 - Impact of Ozanimod on Fecal Calprotectin Levels and the Association With Efficacy in Patients With Moderately to Severely Active Ulcerative Colitis: Results From the Phase 3 True North Study

- SH
Sarah Harris, PhD
Bristol Myers Squibb
Princeton, New Jersey
Presenting Author(s)
1Bristol Myers Squibb, Princeton, NJ; 2Parexel International, Durham, NC
Introduction: Ozanimod (OZA) is approved in the USA and EU for the treatment of moderate/severe ulcerative colitis (UC). OZA demonstrated efficacy in the phase 3 True North (TN) trial in patients (pts) with moderate/severe UC (NCT02435992). Infiltration of neutrophils in intestinal mucosa contributes to inflammation in inflammatory bowel diseases. Calprotectin, which is released by neutrophils, is a neutrophilic activity marker that is useful in monitoring UC disease activity.
Methods: We assessed the effect of OZA on fecal calprotectin (FCP) levels and association with OZA efficacy in TN. During the 10-week (W) induction period, pts were randomized to double-blind (DB) OZA 0.92 mg or placebo (PBO) once daily (Cohort 1) or received open-label (OL) OZA once daily (Cohort 2). Pts with clinical response (CRS) to OZA at W10 were rerandomized to DB OZA or PBO for maintenance through W52. Efficacy endpoints (clinical remission, CRS, endoscopic improvement, mucosal healing, and histologic remission) and FCP levels were assessed at W10 and W52.
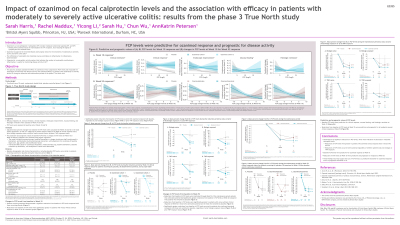
Results: Change in FCP from baseline (BL) to W10 was assessed in 517 pts who received DB OZA (n=347) or PBO (n=170) and 293 who received OL OZA. Pts on OZA demonstrated reductions from BL in FCP at W10; this was significant vs PBO (P< .001, both cohorts) (Table). FCP reductions were significantly greater in pts with vs without CRS at W10 in all treatment groups (P< .001, all groups). Change in FCP from BL to W52 was assessed in 149 pts remaining on OZA and 109 who switched to PBO. FCP levels remained low through W52; pts on continuous OZA had significantly greater FCP reductions at W52 vs pts who switched to PBO (P=.0002). FCP reductions were significantly greater in pts with vs without CRS at W52 in OZA-OZA and OZA-PBO groups (P< .01, for both). Significantly greater reductions from BL in FCP occurred with OZA vs PBO at W10 and W52 regardless of prior biologic or tumor necrosis factor inhibitor exposure (P< .05, all groups). BL FCP level was predictive for CRS and histologic remission at W10 (P< .05, both endpoints). Reduction from BL in FCP at W10 was predictive and prognostic for all endpoints except CRS at W52 (P< .05, all endpoints).
Discussion: OZA treatment led to FCP reductions, indicative of decreases in intestinal neutrophil levels. BL FCP was predictive for OZA response. FCP reductions were predictive for OZA response and prognostic for UC. These findings may support use of FCP as a predictive biomarker for OZA response and prognostic biomarker in UC.
Table. Change from baseline in FCP at Weeks 10 and 52 | |||||
FCP adjusted mean percent change (95% CI) | Induction (Week 10) | Maintenance (Week 52) | |||
Cohort 1 | Cohort 2 | ||||
Placebo (n=170) | Ozanimod (n=347) | Ozanimod (n=293) | Ozanimod-placebo (n=109) | Ozanimod-ozanimod (n=149) | |
All patients | 18.8 (-11.6, 59.6) | -59.3 (-67.1, -49.7) | -71.6 (-77.2, -64.5) | -70.7 (-79.6, -57.7) | -87.7 (-91.0, -83.3) |
Respondersa
| -48.7 (-68.7, -16.0) | -83.9 (-87.8, -78.8) | -86.2 (-89.5, -81.8) | -81.5 (-87.8, -71.7) | -91.0 (-93.7, -87.1) |
Nonrespondersb | 54.9 (12.4, 113.5) | -12.1 (-32.4, 14.4) | -33.3 (-50.9, -9.5) | -10.5 (-53.6, 72.9) | -75.4 (-85.9, -57.2) |
aResponders during induction are pts who achieved CRS at W10, and responders during maintenance are pts who achieved CRS at W52. bNonresponders during induction are pts who did not achieve CRS at W10 and nonresponders at W52 did not achieve CRS at W52. | |||||
Disclosures:
Sarah Harris, PhD1, Rachel Maddux, PhD1, Yicong Li, PhD2, Sarah Hu, PhD1, Chun Wu, PhD1, AnnKatrin Petersen, MD, MS1. E0355 - Impact of Ozanimod on Fecal Calprotectin Levels and the Association With Efficacy in Patients With Moderately to Severely Active Ulcerative Colitis: Results From the Phase 3 True North Study, ACG 2022 Annual Scientific Meeting Abstracts. Charlotte, NC: American College of Gastroenterology.
