Poster Session E - Tuesday Afternoon
Category: Practice Management
E0627 - Health Care Experiences of LGBTQ+ Individuals: A Rochester Pride 2022 Survey

- KH
Kamalpreet S. Hara, MBBS
Mayo Clinic
Rochester, MN
Presenting Author(s)
1Mayo Clinic, Rochester, MN; 2Mayo Clinic, Alix School of Medicine, Rochester, MN; 3Mayo Clinic School of Graduate Medical Education, Rochester, MN
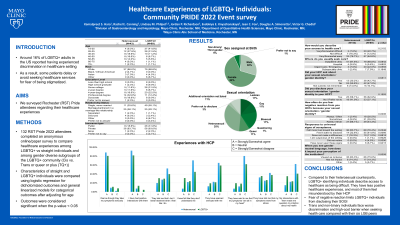
Introduction: Around 16% of LGBTQ+ adults in the US reported having experienced discrimination in healthcare settings, leading some patients to postpone or avoid healthcare services out of fear of stigmatization. We surveyed Rochester (RST) Pride attendees regarding their healthcare experiences.
Methods: At RST Pride 2022, attendees completed an anonymous online/paper survey to compare healthcare experiences among LGBTQ+ vs straight individuals and among gender diverse groups of LGBTQ+ community (Cis vs. Trans or queer or plus (TQ+)). Characteristics of straight and LGBTQ+ individuals were compared using logistic regression for dichotomized outcomes and general linearized models for categorical outcomes after adjusting for age. Outcomes were considered significant when the p-value < 0.05.
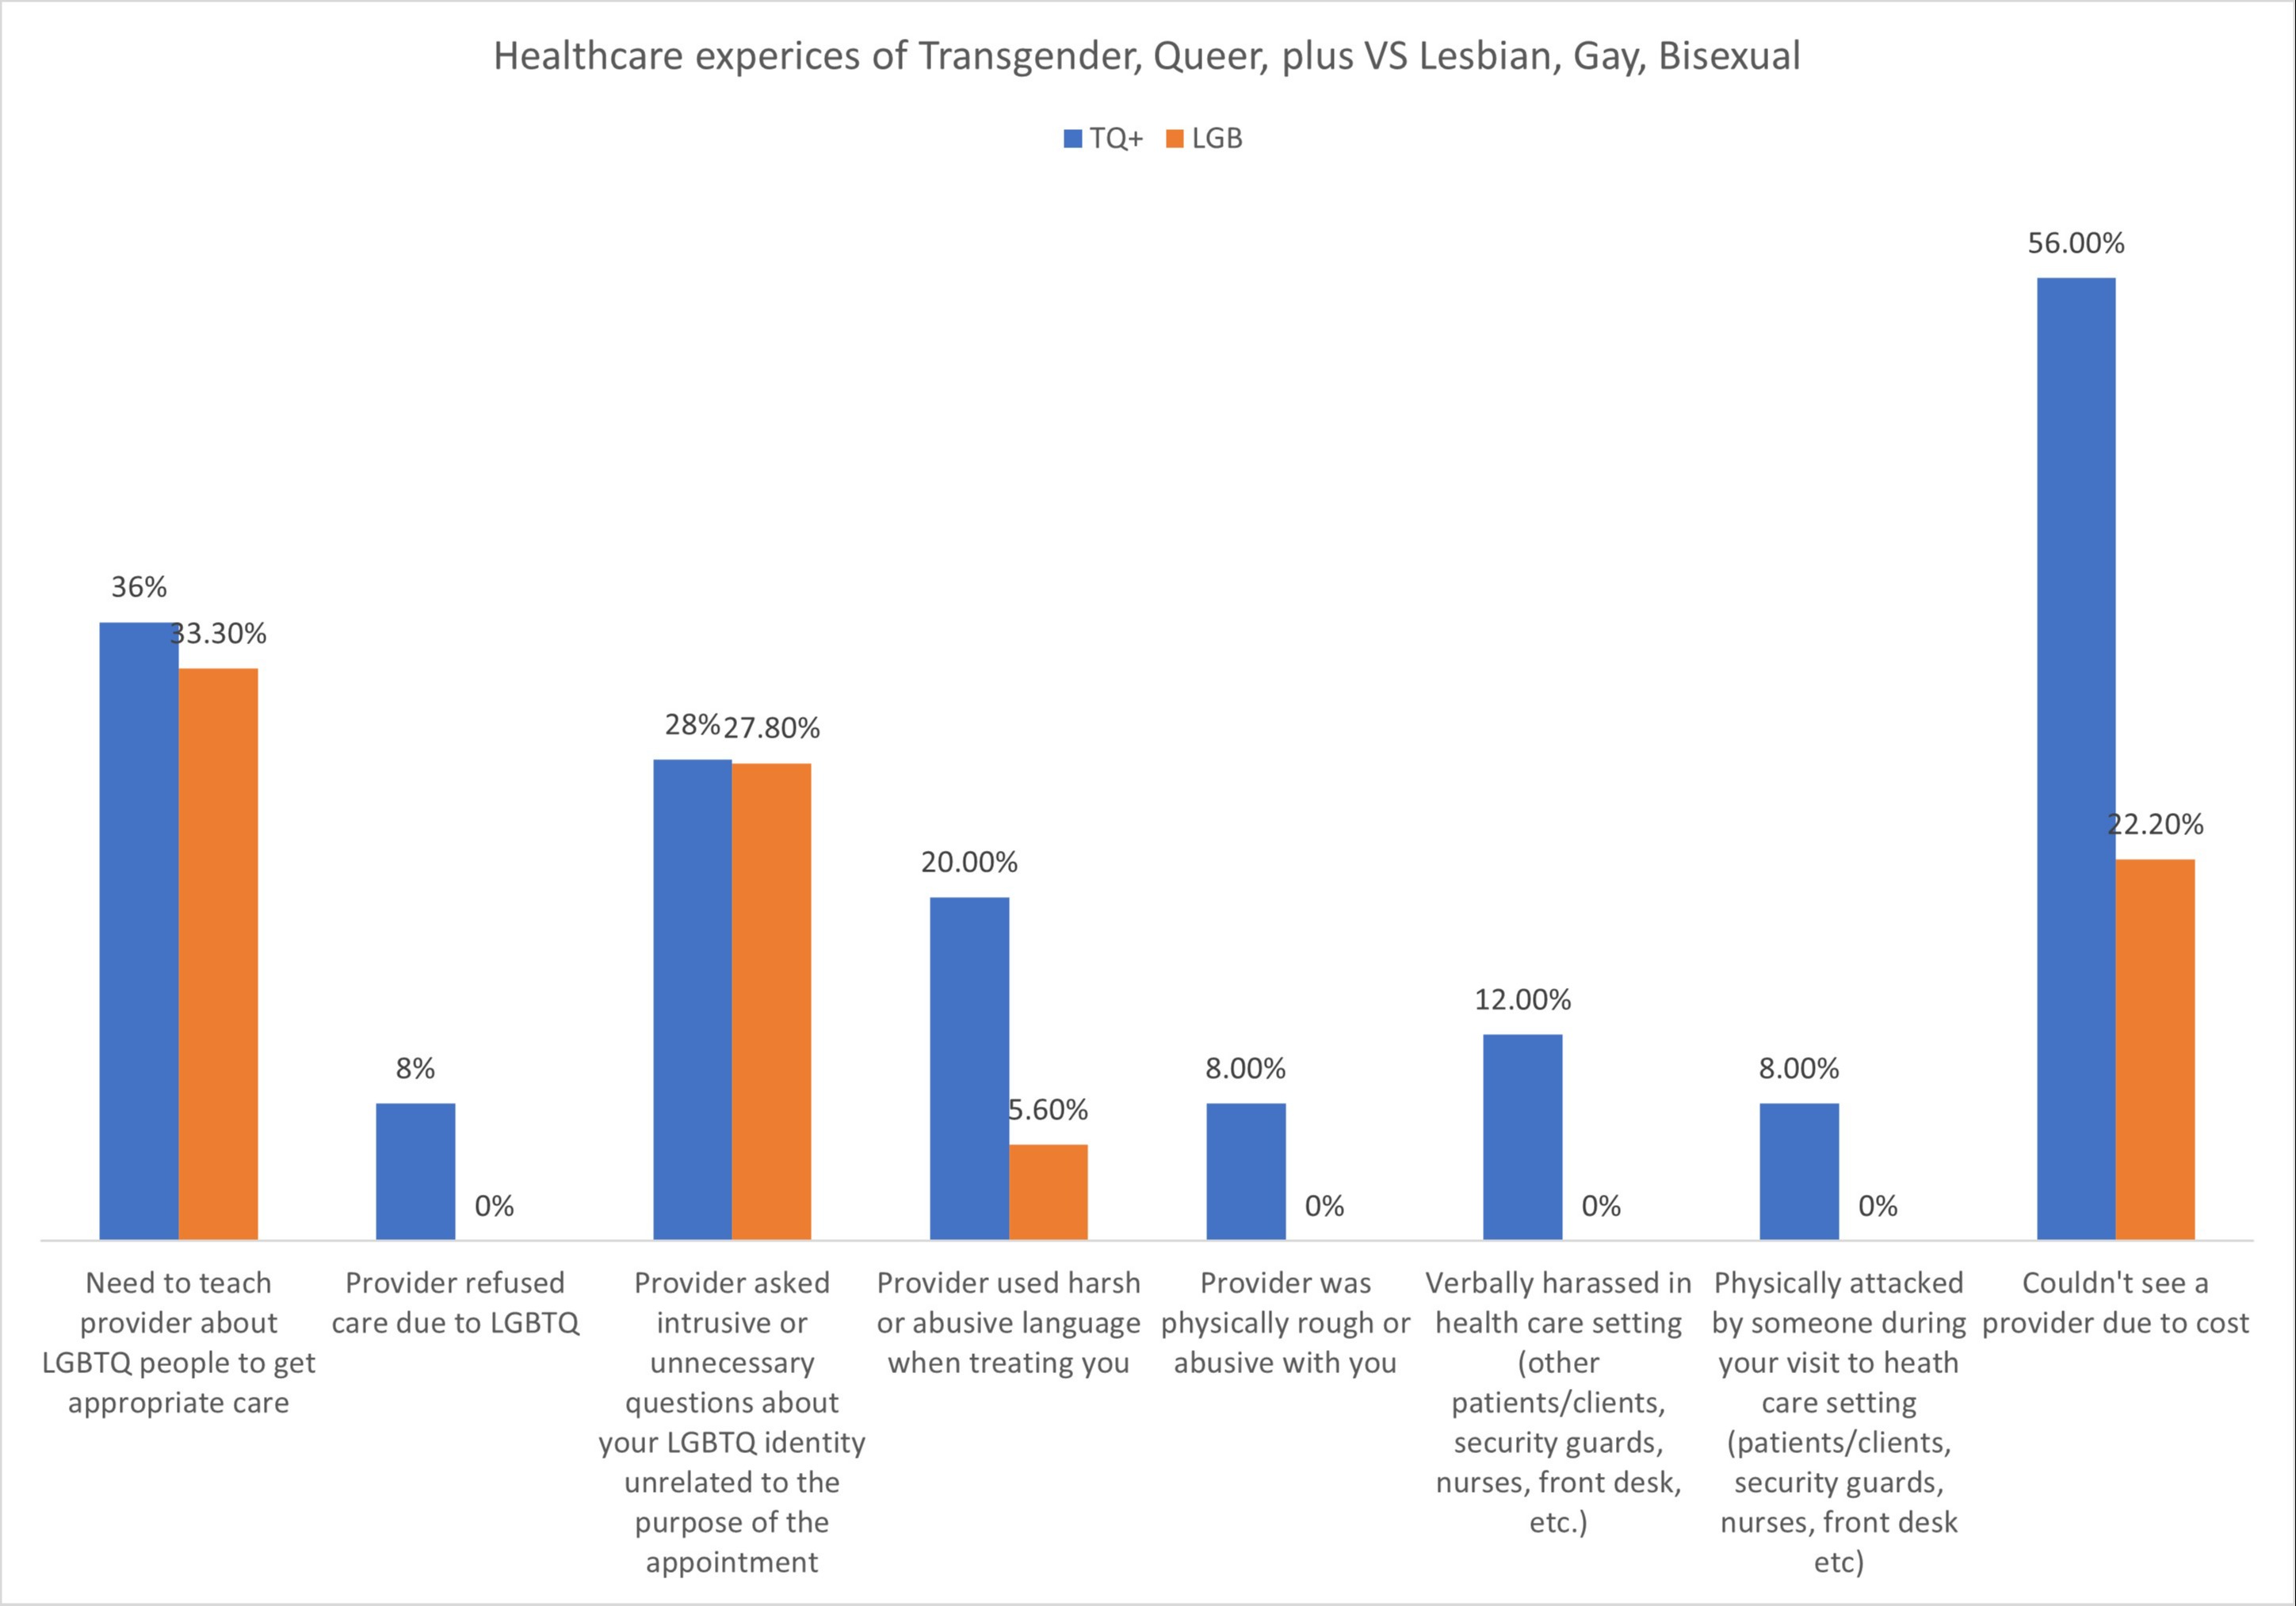
Results: Of 132 respondents, LGBTQ+ respondents (N=89) were younger than straight respondents (N=43) and comparatively had more difficult access to healthcare (22.7% vs 7%; p=0.215). LGBTQ+ reported more public insurance (31.8% vs. 18.6%; p=0.16) and reported seeking urgent/emergent care in greater proportion (22.5% vs. 7%; p=0.055) than straight individuals. 62.9% of LGBTQ+ individuals disclosed their sexual orientation/gender identity (SOGI) to their healthcare provider (HCP) and 38.6% of HCP’s asked their patients about SOGI. Most LGBTQ+ individuals feared negative reaction from HCP because of SOGI (p=0.0006). Universal signs of acceptance in healthcare facilities made LGBTQ+ individuals feel safer to disclose (p=0.006) compared to straight individuals. 67.9% of respondents actively looked for gender-neutral language on intake forms and perceived it being inclusive. LGBTQ+ individuals felt misunderstood by HCP compared to straight individuals (31.0% vs. 7.3%; p=0.005). When comparing healthcare experience of cis-gender (n=37) vs. TQ+ (n=52) LGBTQ+ individuals, TQ+ had more difficult access to care (27.5% vs 16.2%; p=0.113). 2 TQ+ reported being refused care, verbally harassed and physical attacked at healthcare setting because of gender identity compared to zero cis individuals. Cost of care is hugely inhibitive for TQ+ individuals while seeking care (14 vs 4, p=0.036).
Discussion: LGBTQ+ individuals have poor healthcare experiences and reduced healthcare access. Fear of discrimination limits them from disclosing their SOGI. Trans and non-binary individuals face worse discrimination and high-cost barrier when seeking health care compared with their cis LGB peers. These findings will be validated in a larger cohort.

Heterosexual / Straight (N=43) | LGBT+ (N=89) | Total (N=132) | p value | |||||||||||||||||||||||||||||||||||||||||
|
|
| ||||||||||||||||||||||||||||||||||||||||||
|
|
|
| |||||||||||||||||||||||||||||||||||||||||
|
|
|
| |||||||||||||||||||||||||||||||||||||||||
|
|
|
| |||||||||||||||||||||||||||||||||||||||||
|
|
|
| 0.2152 | ||||||||||||||||||||||||||||||||||||||||
|
|
|
|
| ||||||||||||||||||||||||||||||||||||||||
|
| |||||||||||||||||||||||||||||||||||||||||||
|
|
|
| |||||||||||||||||||||||||||||||||||||||||
| ||||||||||||||||||||||||||||||||||||||||||||
|
|
|
|
| ||||||||||||||||||||||||||||||||||||||||
|
| |||||||||||||||||||||||||||||||||||||||||||
|
|
|
| |||||||||||||||||||||||||||||||||||||||||
|
| |||||||||||||||||||||||||||||||||||||||||||
|
|
|
| |||||||||||||||||||||||||||||||||||||||||
|
| |||||||||||||||||||||||||||||||||||||||||||
|
|
|
| |||||||||||||||||||||||||||||||||||||||||
|
| |||||||||||||||||||||||||||||||||||||||||||
|
|
|
| |||||||||||||||||||||||||||||||||||||||||
| ||||||||||||||||||||||||||||||||||||||||||||
|
|
|
|
| ||||||||||||||||||||||||||||||||||||||||
|
| |||||||||||||||||||||||||||||||||||||||||||
|
|
|
| |||||||||||||||||||||||||||||||||||||||||
|
| |||||||||||||||||||||||||||||||||||||||||||
|
|
|
| |||||||||||||||||||||||||||||||||||||||||
| ||||||||||||||||||||||||||||||||||||||||||||
|
| |||||||||||||||||||||||||||||||||||||||||||
|
|
|
| |||||||||||||||||||||||||||||||||||||||||
|
| |||||||||||||||||||||||||||||||||||||||||||
|
|
|
| |||||||||||||||||||||||||||||||||||||||||
|
| |||||||||||||||||||||||||||||||||||||||||||
|
|
|
| |||||||||||||||||||||||||||||||||||||||||
|
| |||||||||||||||||||||||||||||||||||||||||||
|
|
|
| |||||||||||||||||||||||||||||||||||||||||
|
| |||||||||||||||||||||||||||||||||||||||||||
|
|
|
| |||||||||||||||||||||||||||||||||||||||||
|
| |||||||||||||||||||||||||||||||||||||||||||
|
|
|
| |||||||||||||||||||||||||||||||||||||||||
|
| |||||||||||||||||||||||||||||||||||||||||||
|
|
|
| |||||||||||||||||||||||||||||||||||||||||
|
| |||||||||||||||||||||||||||||||||||||||||||
|
|
|
|
Disclosures:
Kamalpreet S. Hara, MBBS1, Rachel Canning, BS1, Lindsey Philpot, PhD, MPH1, Jordan Richardson, 2, Evdokiya Knyazhanskaya, 2, Jean Fox, MD1, Douglas A. Simonetto, MD3, Victor Chedid, MD, MS1. E0627 - Health Care Experiences of LGBTQ+ Individuals: A Rochester Pride 2022 Survey, ACG 2022 Annual Scientific Meeting Abstracts. Charlotte, NC: American College of Gastroenterology.
