Poster Session B - Monday Morning
Category: Esophagus
B0197 - Clinical Utility of an AI-driven Precision Medicine Test for Barrett’s Esophagus: Results From a Randomized Controlled Trial


Rebecca Critchley-Thorne, PhD
Castle Biosciences
Pittsburgh, PA
Presenting Author(s)
1QURE Healthcare, San Francisco, CA; 2Castle Biosciences, Pittsburgh, PA; 3University of North Carolina at Chapel Hill, Chapel Hill, NC; 4University of Colorado, Anschutz Medical Center, Aurora, CO
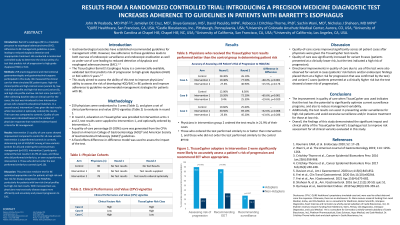
Introduction: Barrett’s esophagus (BE) is a treatable precursor to esophageal adenocarcinoma (EAC). Physician adherence to BE management guidelines is poor, leading to reduced dysplasia detection and inappropriate treatment. We conducted a randomized controlled study to determine the clinical utility of a precision medicine test that predicts risk of progression to high grade dysplasia (HGD) or EAC.
Methods: 259 practicing general and interventional gastroenterologists and gastrointestinal surgeons participated in this IRB-approved study. We measured the clinical care for three simulated BE patient types: non-dysplastic BE, indefinite for dysplasia, and low-grade dysplasia that each had three variants: high-risk clinical profile and high-risk test score [variant A], low-risk clinical profile and high-risk test score [variant B], and high-risk profile and low-risk test score [variant C]. After collecting baseline data on clinical care for the cases, the precision medicine test was introduced to two intervention groups who viewed its educational materials. In a second round, intervention 1 was given the test results while intervention 2 optionally ordered the results. Their care was compared to controls. Quality of care scores were calculated based on the number of physician responses that matched evidence-based criteria for the management of BE.
Results: Intervention 1’s quality of care scores showed improvement compared to control for all case variants (difference-in-difference scores A: +1.8, p=0.600; B: +6.7%, p=0.013; C: +4.3%, p=0.129, see Table). After controlling for physician and practice characteristics, intervention 1 outperformed controls in correctly determining risk of progression to HGD/EAC among all three case variants (p< 0.01 for all) and ordering the correct primary treatment (p=0.02, see Table). Intervention 2 participants ordered the test results in 21.9% of cases, and those who did performed similarly to, or even outperformed, intervention 1. Those who did not order the test performed similarly to controls (p >0.10).
Discussion: This precision medicine test for BE optimized appropriate care for both patients at high-risk and low-risk for disease progression to HGD/EAC, particularly for patients with low-risk clinical profiles but high-risk test results. With increased test use, physicians may treat early disease stages more efficiently and accurately and prevent progression to EAC.
Difference-in-difference* |
| |||||||
Intervention 1 (received risk prediction test results) | Intervention 2 (given option to order risk prediction test) | |||||||
Intervention 1 | Test Orderers | Test Non-Orderers |
| |||||
Diagnosis+Management Quality of Care Scores | ||||||||
Variant A | +1.8% | -5.5% | -1.5% |
| ||||
Variant B | +6.7%** | +6.8% | +3.2% |
| ||||
Variant C | +4.3% | +5.7% | +3.5% |
| ||||
| ||||||||
Correctly Assessing Risk of Progression to HGD/EAC | ||||||||
Variant A | +60.3%** | +73.0%** | -1.2% |
| ||||
Variant B | +65.7%** | +66.6%** | +10.4% |
| ||||
Variant C | +32.6%** | +59.9%** | -1.9% |
| ||||
| ||||||||
Correct Primary BE Management | ||||||||
Eradication therapy | +14.6% | +30.8%*** | -1.0% |
| ||||
Endoscopic surveillance | +18.5%** | +5.9% | +2.5% |
| ||||
| ||||||||
Variant A: high-risk clinical profile and high-risk test result Variant B: low-risk clinical profile and high-risk test result Variant C: high-risk clinical profile and low-risk test result
*Compared to controls; **p-value < 0.05; ***p-value < 0.10 |
| |||||||
Disclosures:
John Peabody, MD, PhD1, Jamielyn Cruz, MD1, David Paculdo, MPH1, Divya Ganesan, MS1, Rebecca Critchley-Thorne, PhD2, Nicholas J. Shaheen, MD, MPH, MACG3, Sachin Wani, MD4. B0197 - Clinical Utility of an AI-driven Precision Medicine Test for Barrett’s Esophagus: Results From a Randomized Controlled Trial, ACG 2022 Annual Scientific Meeting Abstracts. Charlotte, NC: American College of Gastroenterology.
